Master Trend Acceleration: Ultimate Guide to the CCM Three Indicator
In the highly competitive landscape of technical analysis, tracking a single momentum variable frequently leaves traders exposed to sudden market traps. A currency pair might experience a brief spike in price velocity, but without sustained volume and volume-weighted trend confirmation, that spike often results in a painful false breakout. To filter out late-session market noise and accurately target high-probability execution zones, seasoned technical analysts rely on multi-layered momentum arrays.
The CCM Three indicator provides a robust answer to this structural challenge. By integrating three independent momentum calculations into a single, synchronized visual engine, this advanced software exposes precise institutional accumulation and distribution phases.
What is the CCM Three Indicator?
The CCM Three indicator is a premium, multi-velocity momentum oscillator tailored for active trading platforms. It unifies complex momentum variables—cross-referencing short-term price cycles against broad trend baselines—to gauge the exact health of an ongoing trend.
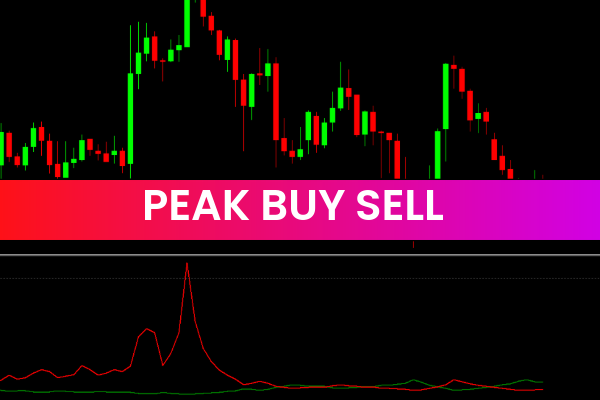
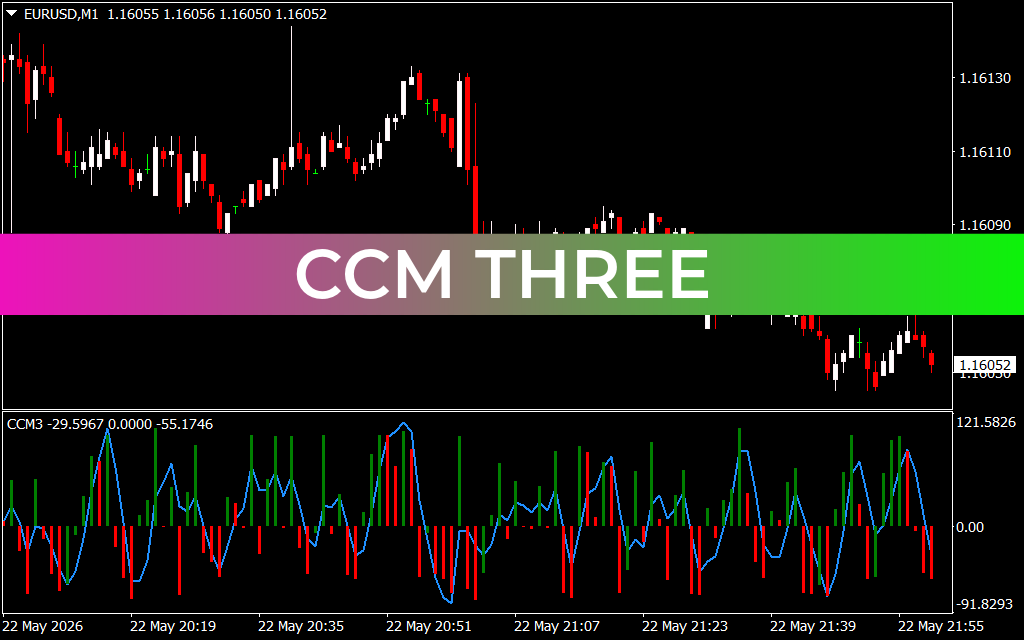
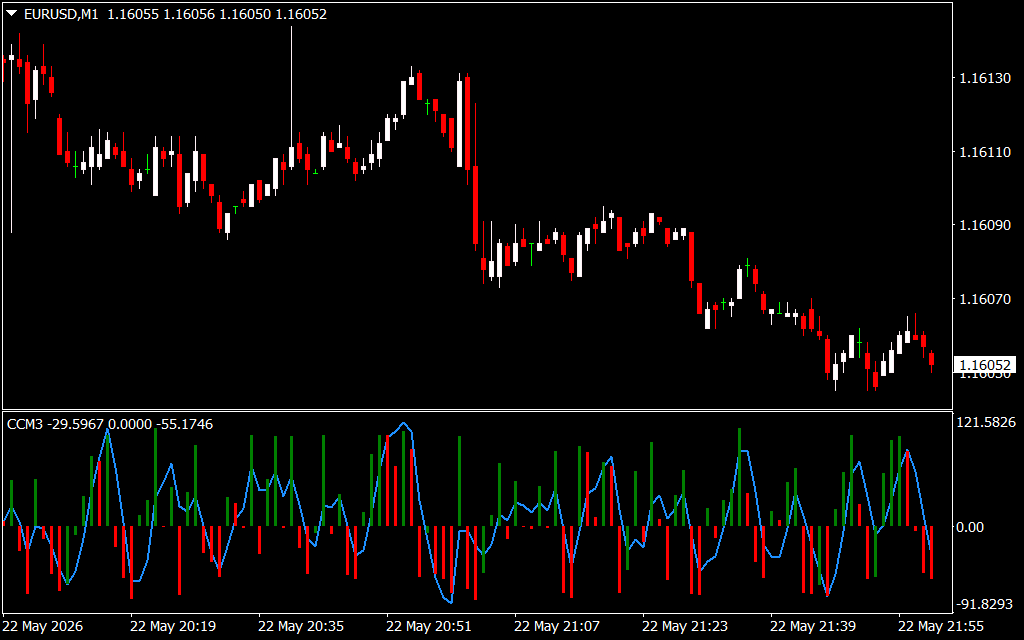
As demonstrated in the EUR/USD 1-minute (M1) chart above, the indicator outputs an incredibly clean, hybrid visual display (CCM3) in a dedicated sub-window beneath the Price Action. The system pairs a highly responsive blue oscillator line with a dual-colored vertical histogram track that fluctuates dynamically above and below a central zero equilibrium line. When momentum accelerates aggressively to the upside, vibrant green bars expand upward; when sellers seize control, solid red bars extend downward, offering high-frequency scalpers and swing traders clear structural guidance.
Key Features and Strategic Advantages
- Triple-Engine Confluence: Combines multiple momentum layers into a unified oscillator matrix, removing the need to stack multiple bulky windows on your workspace.
- Dynamic Zero-Line Tracking: Seamlessly monitors transitions across the central zero axis, helping you spot the exact moment a market transitions from consolidation to expansion.
- High-Contrast Histogram Bars: Uses distinct color coding (green for strong bullish intent, red for intense bearish pressure) to let you gauge institutional backing in a fraction of a second.
- Optimized Scalping Mechanics: Delivers exceptional behavioral clarity on fast-moving, lower-timeframe layouts like the M1 or M5 horizons where market noise is typically highest.
How to Trade with CCM Three
Integrating the multi-layered CCM Three system into your mechanical execution strategy streamlines your daily chart analysis:
- The Institutional Buy Trigger: Look for the blue oscillator wave to cross cleanly above the zero line concurrently with the appearance of steady green histogram bars. This dual confirmation signals an efficient influx of buying volume, offering a high-probability entry for long positions.
- The Institutional Sell Trigger: Conversely, when the blue signal line plunges below the zero axis and the histogram bars expand downward in solid red, selling pressure has captured the asset. This structural shift provides an ideal environment to initiate shorts or lock in profits on existing longs.
For elite performance, cross-reference these automated sub-window crossovers with major chart structure, such as horizontal Support And Resistance keys, daily pivot zones, or structural order blocks.
3 Downloads
Last Update:
May 24, 2026 02:57 AM
Published:
Jan 15, 2026 15:29 PM
Category: