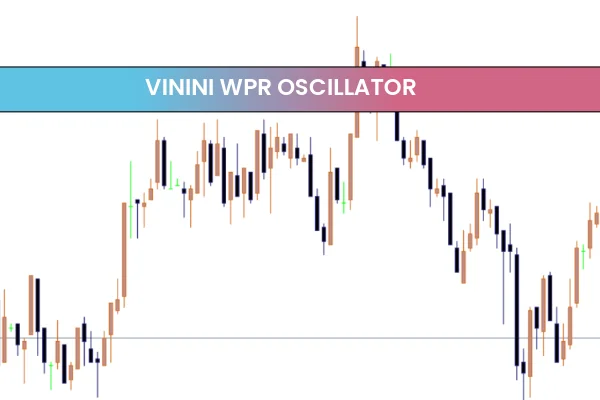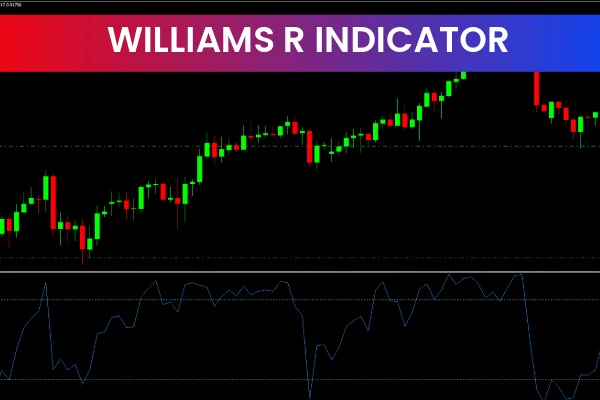
The Williams %R Indicator is one of the most popular and widely used momentum indicators in Forex trading. Available for free on the MetaTrader 4 (MT4) platform, this indicator helps traders identify overbought and oversold market conditions, making it easier to spot potential reversals and high-probability trading opportunities.
Developed by legendary trader Larry Williams, the Williams %R indicator measures the position of the current closing price relative to the highest high and lowest low over a selected period.
How the Williams %R Indicator Works
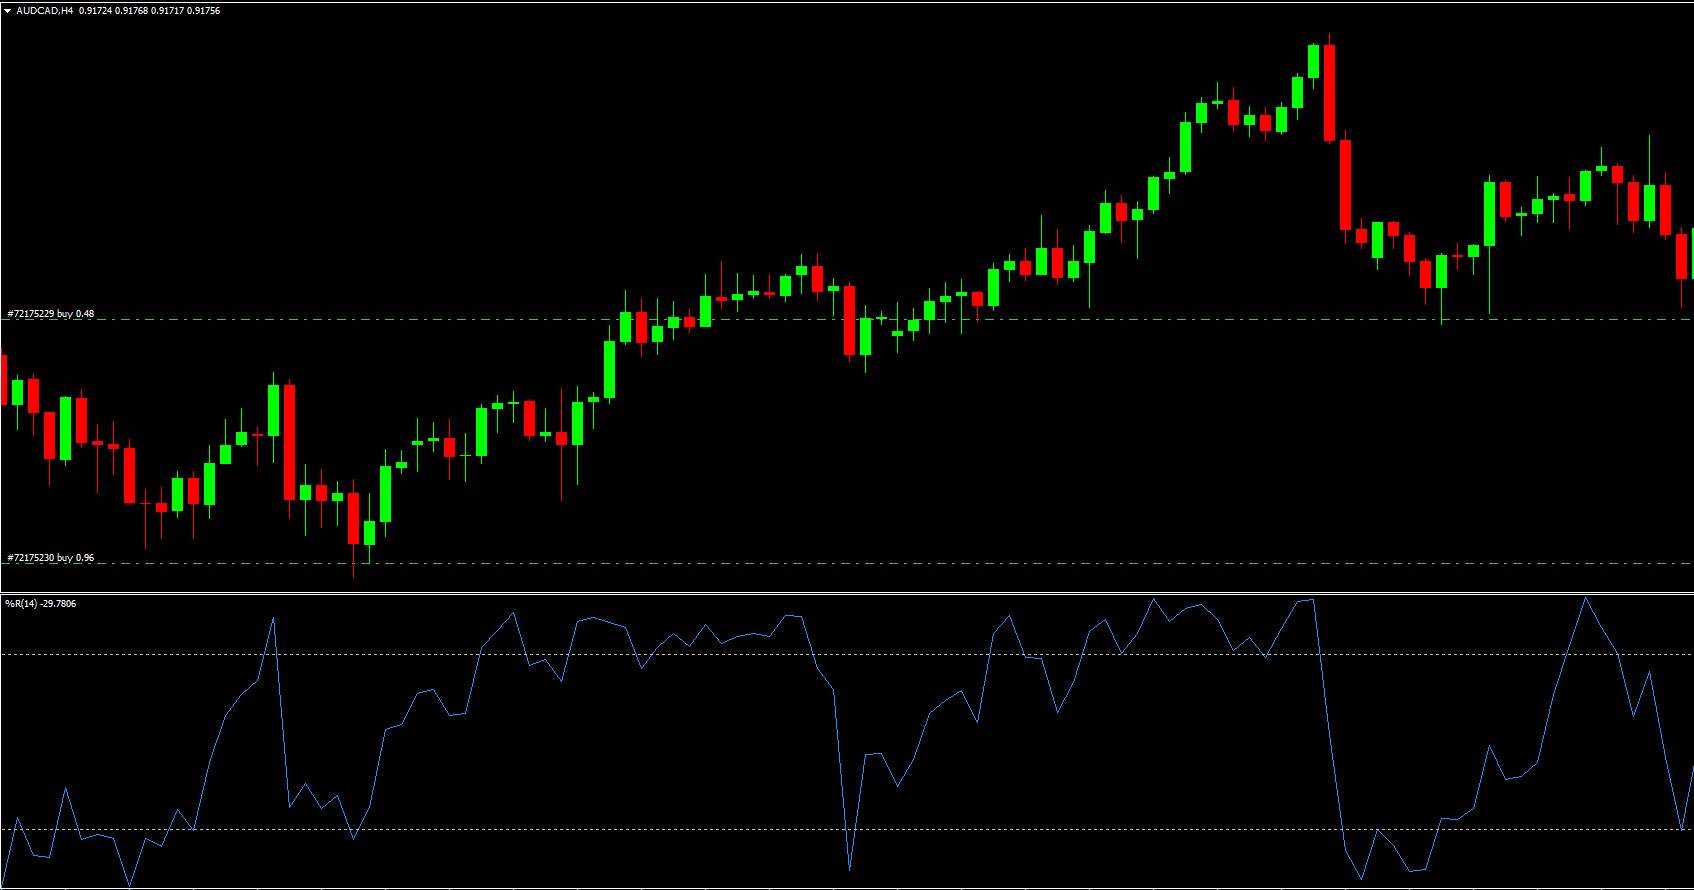
The Williams %R indicator is a momentum oscillator that moves between 0 and -100. It compares the closing price of a currency pair to its recent trading range.
The indicator readings are interpreted as follows:
Above -20 → Overbought market
Below -80 → Oversold market
These levels help traders anticipate potential price reversals before they occur.
Understanding Overbought and Oversold Signals
When the Williams %R line rises above -20, it suggests that price is trading near its recent highs and may be due for a correction or reversal.
When the indicator falls below -80, it suggests that price is trading near its recent lows and may be preparing for a bullish reversal.
These signals are especially powerful when confirmed with Price Action or trend direction.
Key Features of the Williams %R Indicator
The Williams %R Indicator offers several advantages:
Simple and easy-to-read oscillator
Identifies overbought and oversold conditions
Helps detect potential trend reversals
Works on all MT4 timeframes
Suitable for all currency pairs
Free and built into the MT4 platform
Its simplicity makes it ideal for both beginner and advanced traders.
Benefits of Using the Williams %R Indicator
Forex traders use the Williams %R Indicator to:
Improve entry and exit timing
Identify momentum exhaustion
Avoid buying at market tops
Avoid selling at market bottoms
Enhance short-term and swing trading strategies
It is particularly effective in ranging and sideways markets.
Trading Strategies Using the Williams %R Indicator
Overbought and Oversold Strategy
Look for sell opportunities when the indicator moves above -20 and then turns downward.
Look for buy opportunities when the indicator drops below -80 and then turns upward.
Trend Confirmation Strategy
In trending markets, traders can use Williams %R to enter trades in the direction of the trend by waiting for pullbacks into overbought or oversold zones.
Divergence Strategy
Bullish or bearish divergence between price and the Williams %R indicator can signal weakening momentum and potential reversals.
Best Timeframes for the Indicator
The Williams %R Indicator works well across all timeframes:
Lower timeframes for Scalping
Medium timeframes for intraday trading
Higher timeframes for swing trading
Higher timeframes tend to produce more reliable signals with less noise.
Combining Williams %R with Other Indicators
For stronger confirmation, traders often combine Williams %R with:
Moving averages
RSI or Stochastic indicators
Support And Resistance analysis
Candlestick patterns
You can find more momentum and oscillator indicators on IndicatorForest.com to build complete Forex trading systems.
Final Thoughts on the Williams %R Indicator
The Williams %R Indicator is a classic and powerful momentum tool that remains highly relevant in modern Forex trading. Its ability to identify overbought and oversold conditions makes it a valuable addition to any MT4 trading strategy.
Whether you are a beginner or an experienced trader, this indicator can help you make more informed trading decisions and improve your market timing.
👉 Visit IndicatorForest.com to discover more free MT4 indicators, Forex strategies, and professional trading tools.
Published:
Dec 28, 2025 17:32 PM
Category: