Mastering Momentum with the Moving Average of Oscillators (OsMA)
In the toolkit of a professional technical analyst, identifying the exact moment a trend begins to accelerate or decelerate is the holy grail of trading. While standard oscillators like MACD provide a foundation for trend analysis, they can sometimes lag behind rapid price shifts. The Moving Average of Oscillators (OsMA) is a high-precision Momentum Indicator for MetaTrader 4 (MT4) designed to solve this by measuring the distance between an oscillator and its signal line, offering a "second-derivative" view of market strength.
What is the Moving Average of Oscillators?
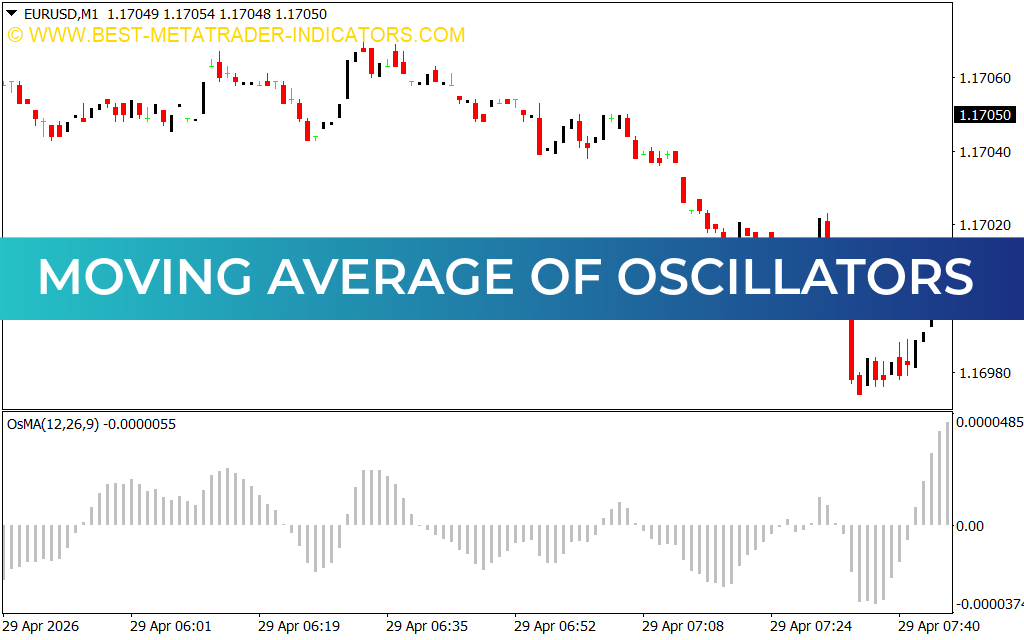
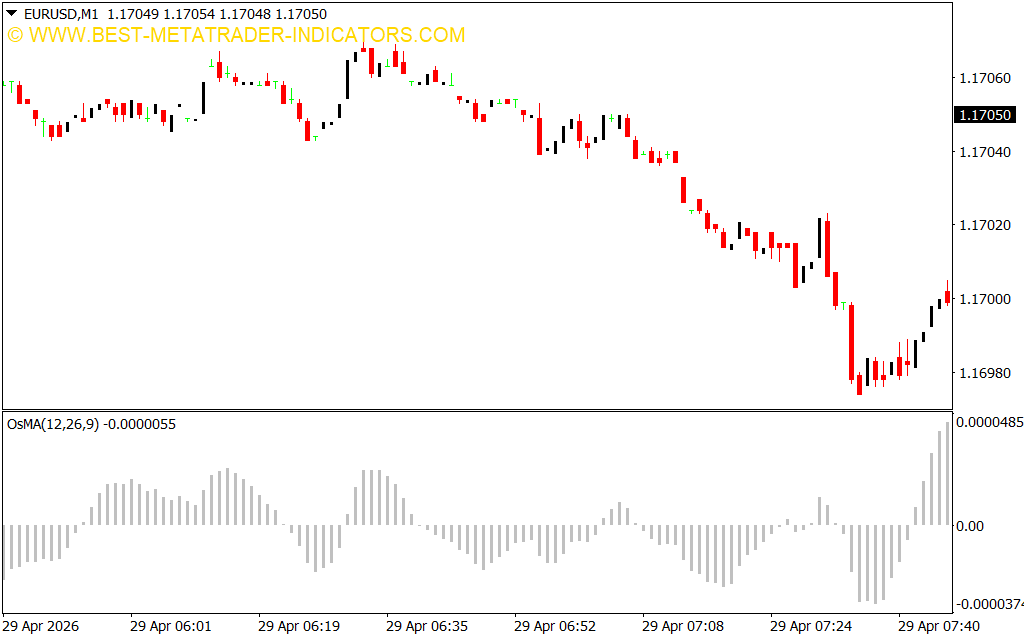
The OsMA is technically a "confirmation" indicator that calculates the difference between an oscillator (most commonly the MACD) and its moving average (the signal line). When the oscillator is above its signal line, the OsMA value is positive; when it is below, the value is negative. This relationship is visualized as a histogram that fluctuates above and below a central zero line.
As seen on the EUR/USD M1 chart, the OsMA appears in a sub-window as a series of vertical bars. Unlike standard histograms that simply follow price, the OsMA histogram specifically tracks the momentum of the momentum. This allows traders to see when a trend is losing its "push" long before the Price Action actually turns around.
Why the OsMA is a Leading Signal
The primary advantage of the OsMA is its ability to act as a leading indicator for trend exhaustion:
- Early Reversal Detection: When the OsMA histogram bars start getting shorter while price is still making new highs, it indicates that the underlying buying pressure is evaporating.
- Trend Acceleration: Conversely, as the bars grow longer away from the zero line, it confirms that the current trend is gaining strength and institutional participation is increasing.
- Noise Reduction: By calculating the difference between two averages, the OsMA filters out minor price "hiccups," allowing traders to stay in profitable trends longer without being shaken out by volatility.
Strategic Trading Applications
The Moving Average of Oscillators is a versatile tool that enhances both Scalping and swing trading strategies:
- The Zero-Line Crossover: A classic buy signal is generated when the OsMA histogram crosses from negative to positive. This indicates that the short-term momentum has officially overtaken the long-term average.
- Divergence Analysis: This is perhaps the most powerful use of the OsMA. If price makes a lower low but the OsMA histogram makes a higher low (bullish divergence), it is a high-probability signal that a massive bullish reversal is imminent.
- Scalping on the M1: For high-frequency traders, the first "shrinking" bar after a long expansion serves as an early exit trigger, allowing you to lock in profits at the absolute peak of a momentum surge.
Conclusion
The Moving Average of Oscillators is an essential asset for traders who demand a deeper look into market dynamics. By quantifying the gap between trend and signal, it removes the guesswork from trend analysis and provides a clear mathematical map of buyer and seller conviction. Whether you are filtering breakouts or hunting for trend reversals, the OsMA provides the structural confidence needed to master market timing and trade with a professional edge.
2 Downloads
Last Update:
Apr 29, 2026 16:24 PM
Published:
Jan 30, 2026 20:44 PM
Category: