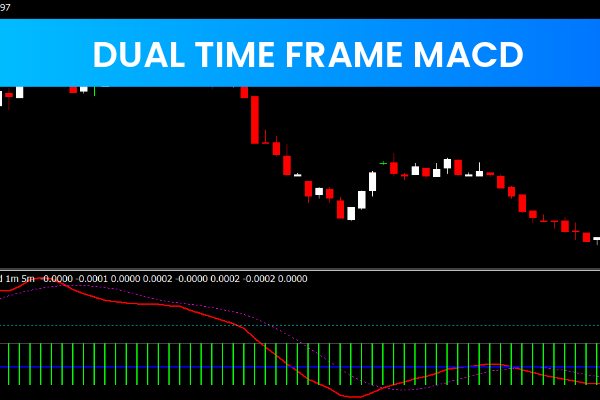
The Dual Time Frame MACD Indicator MT4 is a popular and free Forex Indicator designed for the MetaTrader 4 (MT4) platform. This indicator allows traders to compare trend strength and direction across two different time frames using the well-known Moving Average Convergence/Divergence (MACD) tool. By analyzing multiple time frames simultaneously, traders can make more informed decisions about entries, exits, and overall market direction.
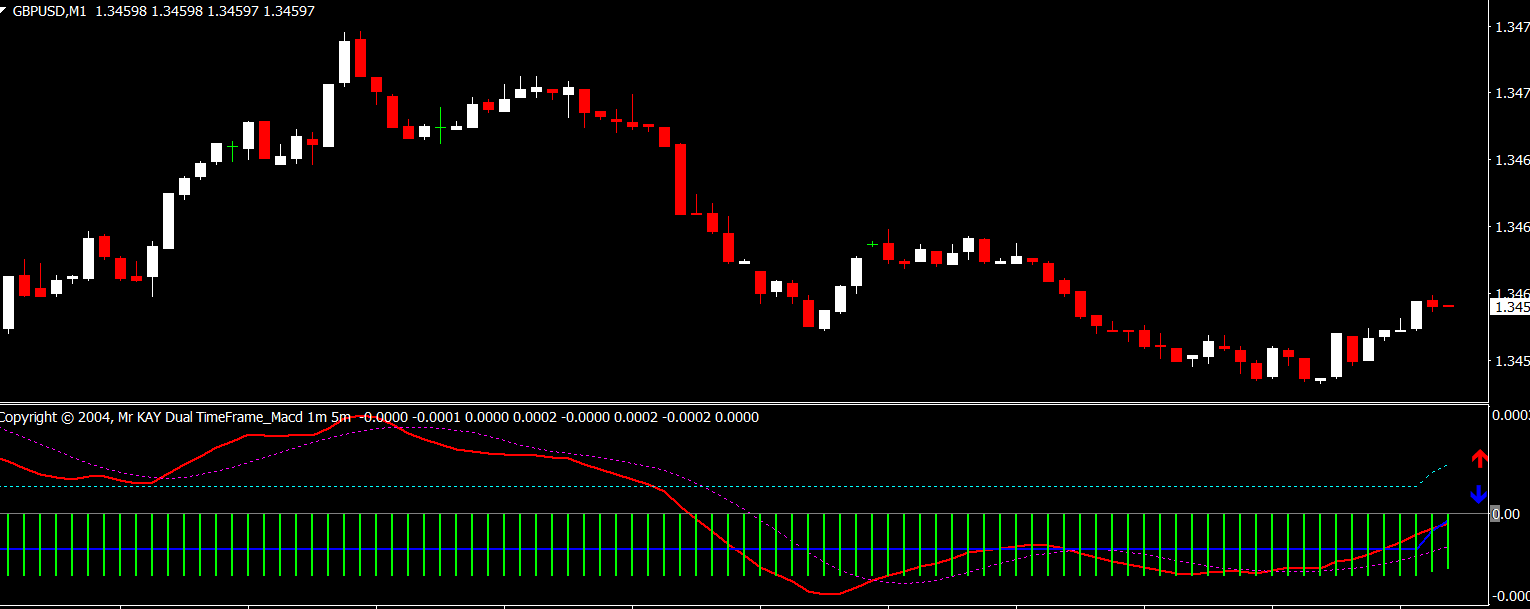
Unlike the standard MACD, which only considers a single time frame, the Dual Time Frame MACD Indicator MT4 measures the difference between MACD lines of two chosen time frames. This difference is displayed in a histogram, providing a clear visual representation of which time frame has stronger momentum.
How the Dual Time Frame MACD Indicator Works
The indicator calculates the MACD values for the two selected time frames and then plots the difference as a histogram on the chart. This histogram helps traders determine whether the longer-term trend is stronger or weaker than the shorter-term trend. A positive histogram reading indicates the longer-term trend is stronger, while a negative reading suggests the short-term trend is dominant.
This approach allows traders to avoid false signals and improves the accuracy of trend-based strategies by highlighting where the real momentum lies.
Key Features of the Indicator
Trend Comparison Across Time Frames
By comparing two MACD lines, the indicator provides insight into trend alignment, helping traders identify high-probability trades.
Histogram Display
The histogram visually shows the difference between the two MACD lines, making it easy to interpret relative strength.
Optional MACD Lines Display
Traders can choose to display MACD lines for both time frames on the chart, allowing for a complete visual comparison.
Ease of Use
The indicator is simple to install and configure on any MT4 chart. Traders just select the two time frames they want to compare, and the indicator handles the rest automatically.
How Traders Can Use the Dual Time Frame MACD
Identifying Trend Strength
Traders can use the histogram to determine whether the overall market momentum is aligned with the trend on their preferred trading time frame. Strong alignment between long-term and short-term trends often signals a higher probability of successful trades.
Entry and Exit Signals
When the histogram shows a strengthening trend in the desired direction, it can serve as a confirmation for entering a trade. Conversely, weakening histogram readings may indicate a potential exit or Trend Reversal, helping traders manage risk effectively.
Combining with Other Indicators
For best results, the Dual Time Frame MACD Indicator can be combined with Support And Resistance levels, moving averages, or candlestick analysis. This combination allows traders to confirm trend strength while maintaining a broader market perspective.
Why Forex Traders Prefer This Indicator
Free to use on MT4
Provides multi-time frame trend analysis
Easy to read and interpret
Works well for swing trading, Scalping, and day trading
Enhances decision-making by reducing false signals
The Dual Time Frame MACD Indicator MT4 is particularly useful in Forex trading, where trends across different time frames can vary significantly. Traders who monitor multiple time frames simultaneously can gain a better understanding of market conditions and improve their trade timing.
Final Thoughts
The Dual Time Frame MACD Indicator MT4 is an essential tool for traders who want to combine the reliability of MACD with the power of multi-time frame analysis. By providing clear insights into trend strength and direction, it can enhance trading strategies and improve decision-making.
For Forex traders looking to elevate their analysis and trade more confidently, this indicator is a must-have.
👉 Visit IndicatorForest.com to download free MT4 indicators and explore more tools to boost your Forex trading strategies.
FAQ
1 Download
Published:
Dec 22, 2025 13:51 PM
Category: