Riding the Waves: The Extreme TMA Line Indicator for MetaTrader 5
Trading within established market boundaries is one of the most reliable ways to secure consistent profits in Forex. Trends rarely move in a straight line; instead, they oscillate within hidden price channels. The Extreme TMA Line Indicator for MetaTrader 5 (MT5) is an advanced technical tool designed to map out these dynamic channels, giving traders clear parameters for identifying overextended markets, trend directions, and high-probability reversal zones.
What is the Extreme TMA Line Indicator?
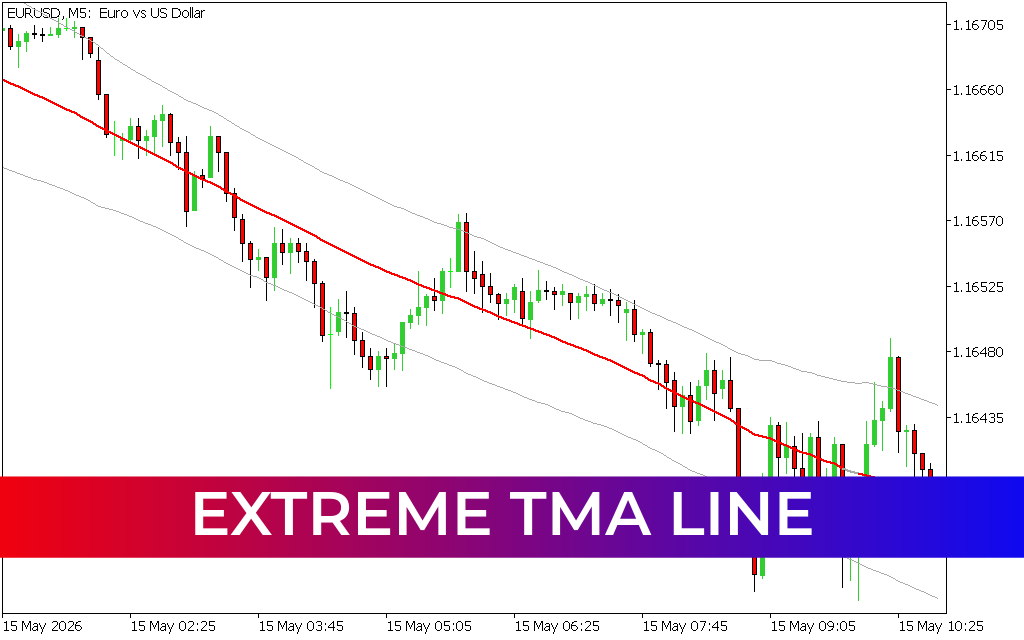
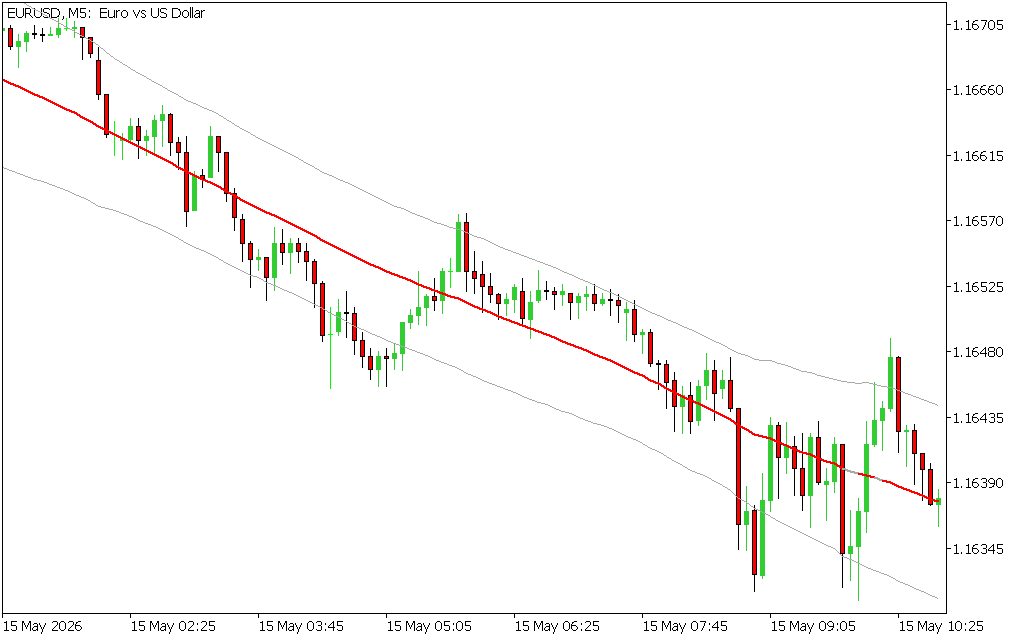
The indicator is based on the Triangular Moving Average (TMA), a type of moving average that undergoes double smoothing. This extra smoothing process makes the TMA significantly more responsive to major price cycles while filtering out the erratic price spikes that often plague standard moving averages.
The Extreme TMA Line indicator projects a dynamic channel directly onto your main MT5 chart consisting of three core components:
- The Center Line (Red): Represents the core trend direction and the market's current fair value.
- The Upper Band (Grey): Acts as a volatile, rolling resistance level.
- The Lower Band (Grey): Serves as a dynamic, rolling support level.
When Price Action stretches outside of these outer bands, it has entered an "extreme" condition, signaling that a regression toward the center line is highly probable.
Key Trading Strategies with MT5 Extreme TMA
The unique layout of the Extreme TMA Line makes it an exceptionally versatile tool for both trend-following and counter-trend trading styles.
1. Channel Trading in Range-Bound Markets
During non-trending or consolidating market phases, price will bounce reliably between the upper and lower bands.
- Buy Setup: When the price drops to touch or pierce the lower grey band, the asset is considered oversold. Traders can look for bullish price action confirmation to enter a long position targeting the red center line.
- Sell Setup: When the price climbs to test the upper grey band, it becomes overbought. Traders can anticipate a pullback and look for short entries targeting the center band.
2. Trend Riding and Breakout Filters
In a strong, established trend, the Extreme TMA bands tilt sharply in the direction of the move. In a strong downtrend, for instance, the red center line acts as a strict ceiling of resistance. Traders can use the upper and lower bands to measure market exhaustion, avoiding buying at the absolute top of a bullish rally or selling at the very bottom of a market flush.
Maximizing Performance on MT5
The MetaTrader 5 engine allows the Extreme TMA Line indicator to calculate complex mathematical smoothing across multiple timeframes simultaneously without lagging your platform. It works beautifully across all asset classes, from micro-Scalping on the 5-minute chart to high-level swing trading on the daily chart.
To achieve maximum accuracy, pair the Extreme TMA Line with a momentum oscillator like the RSI or a Volatility Quality filter. This ensures you only take trades when the price hits a channel extreme and market momentum confirms the reversal.
10 Downloads
Last Update:
May 16, 2026 14:26 PM
Published:
Jan 21, 2026 12:00 PM
Category: