Unleashing Institutional Precision: Trading Key Zones with the Fibonacci Cluster Indicator
In highly competitive financial markets, achieving long-term profitability requires moving past basic retail indicators. On intraday timeframes like the 30-minute (M30) chart, day traders are constantly challenged by sudden volatility shifts, structural traps, and deceptive breakout attempts. Relying on single technical lines often leads to premature trade entries or stops getting hit prematurely due to market noise. To isolate high-probability turning points with precision, professional market makers look for confluence—specifically by plotting a Fibonacci Cluster.
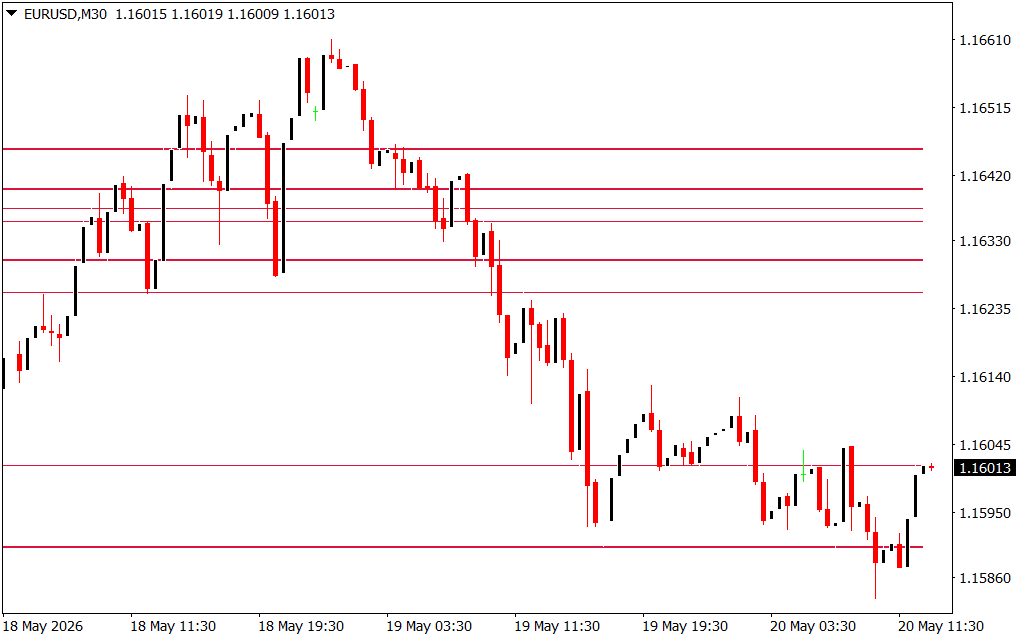
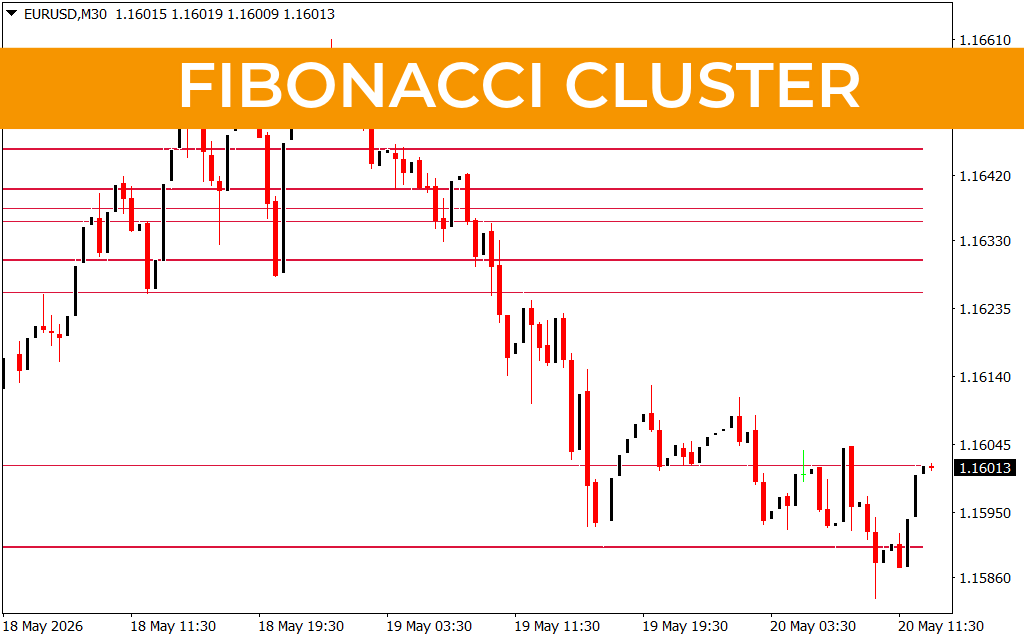
A deep look at the EUR/USD M30 price delivery highlights a classic institutional market cycle. The asset initially undergoes a steep, multi-day markdown phase, dropping from distribution peaks to carve out a series of lower highs and lower lows. This intensive selling climax eventually pushes the exchange rate into an institutional liquidity floor near 1.15860. Right after this sell-stop sweep, aggressive accumulation stabilizes Price Action, triggering a rapid, multi-candle V-shaped recovery back toward the 1.16013 level. Tracking these major structural pivots is exactly where an automated confluence matrix provides a distinct trading edge.
The Power of Multi-Layered Confluence
A standard Fibonacci retracement tool calculates hidden Support And Resistance boundaries based on a single price swing. While useful, single levels are frequently breached during volatile sessions. The Fibonacci Cluster indicator solves this limitation by simultaneously tracking multiple historical swing highs and swing lows across various timeframes.
When several distinct Fibonacci retracement or extension levels overlap within a tight price range, the software identifies a high-confluence horizontal zone. These dense matrices represent major institutional Supply And Demand pockets:
- Sustained Trend Resistance: During the initial, aggressive markdown phase, the market pulls back to test localized counter-trend peaks. The indicator projects a series of tight horizontal red lines across the chart. Because these boundaries represent a cluster of overlapping ratios, they function as a powerful ceiling, giving traders the confidence to hold short positions.
- Pinpointing the True Accumulation Floor: Notice the exact moment the EUR/USD washes out its low near 1.15860. As price enters this deep demand pocket, it hits a dense cluster of historical extension targets. This major confluence signals structural seller exhaustion, alerting day traders to immediately take profits on shorts and look for high-probability reversal setups.
- Objective Target Projection: During the subsequent V-shaped recovery, the cluster lines above current price action serve as clear, objective take-profit targets, preventing traders from leaving money on the table.
Streamlining Platform Infrastructure and Rules
Sustaining an edge in the forex and CFD markets requires removing emotional guesswork from your daily execution template. Automating your confluence analysis with a dedicated charting script replaces subjective trendline drawing with clinical mathematical discipline.
The Fibonacci Cluster script handles complex calculations in the background, rendering clean layouts across your terminal without causing performance lag. The fully customizable interface allows you to select specific lookback periods, fine-tune cluster density tolerances, and configure real-time alert notifications. Integrating this robust script into your platform provides the technical clarity needed to trade alongside institutional order flow and protect your equity base with absolute precision.
5 Downloads
Last Update:
May 20, 2026 16:32 PM
Published:
Jan 18, 2026 15:15 PM
Category: