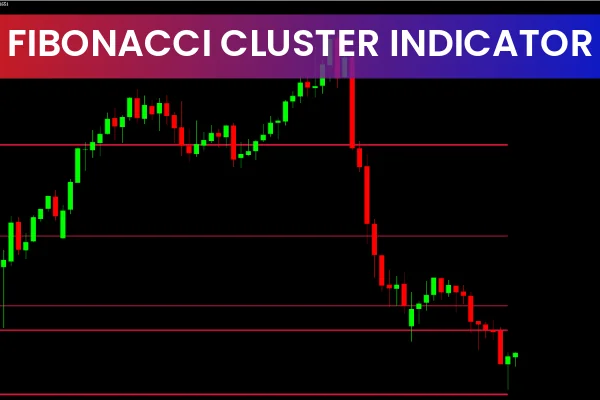
The Fibonacci Cluster Indicator for MT4 automatically generates dynamic Support And Resistance lines on forex charts. By combining Fibonacci levels with the ATR (Average True Range), the indicator adapts to price volatility, plotting clusters of support and resistance lines that help traders identify the most significant levels for trading.
This tool is ideal for both new and experienced forex traders, and it works across all timeframes for short-term and long-term technical analysis.
Fibonacci Cluster Indicator Trading Signals
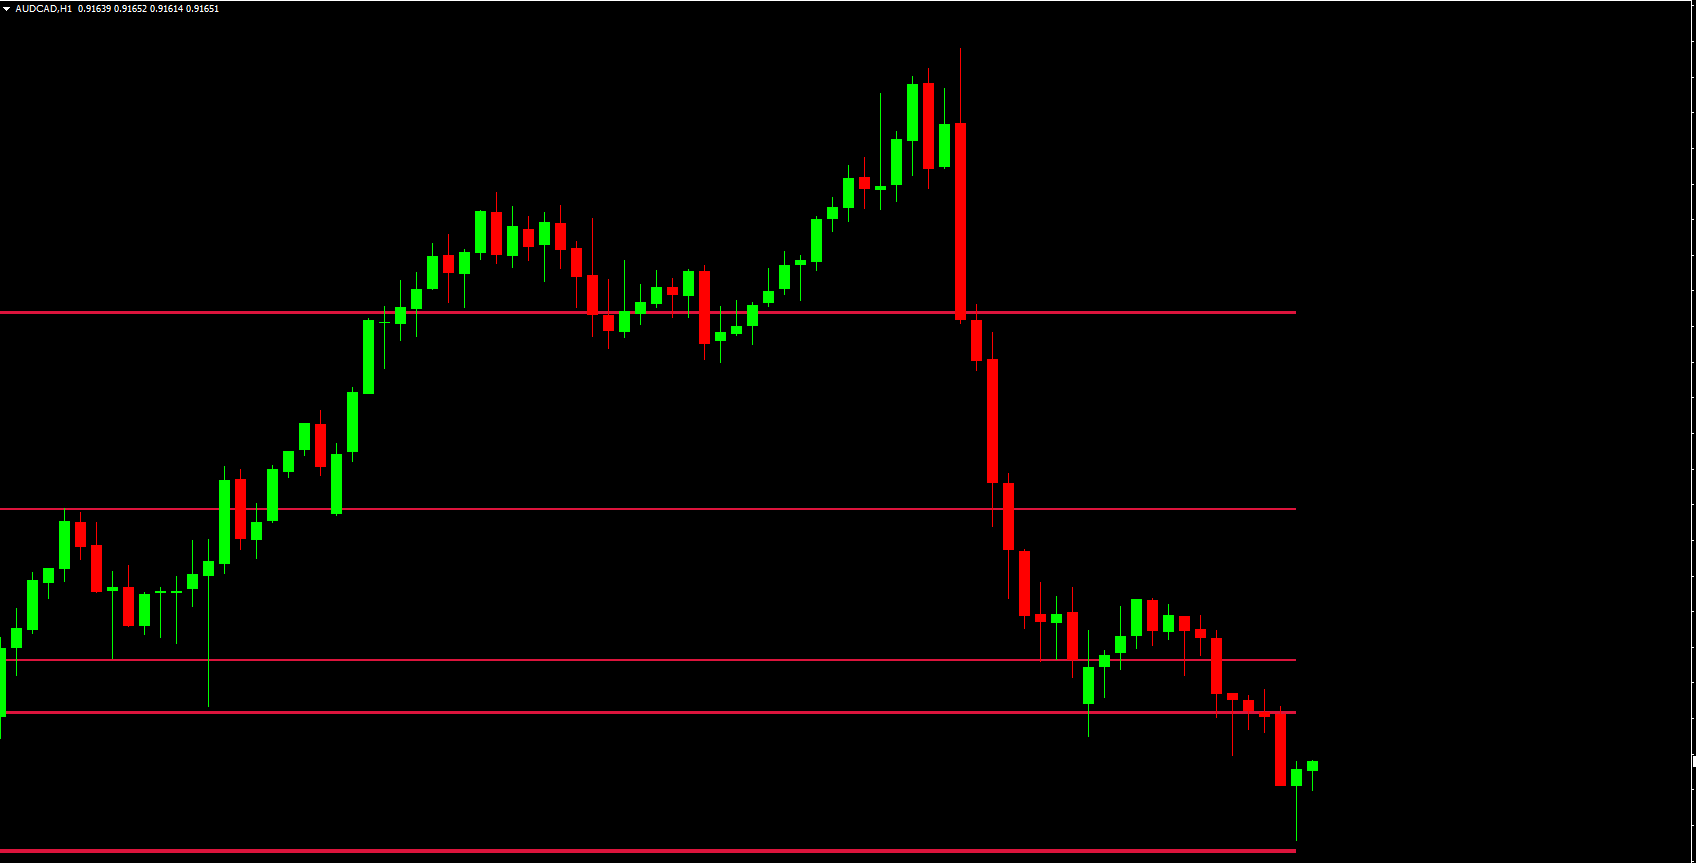
The indicator plots red support and resistance lines on the chart:
It identifies the highest high and lowest low to calculate Fibonacci levels.
The ATR is applied with a multiplier to adjust these levels based on current market volatility.
Multiple lines form a cluster, with areas containing more lines acting as stronger support or resistance zones.
Trading Strategy:
Enter trades at a breakout or breakout failure of these support and resistance lines.
Combine with other technical indicators for confluence and improved accuracy.
Strongest signals are often found where multiple lines converge in a cluster.
Conclusion
The Fibonacci Cluster Indicator for MT4 is a dynamic support and resistance tool that leverages Fibonacci ratios and ATR-based volatility to enhance trading decisions. Its clusters clearly highlight the most important levels for potential breakouts or reversals. The indicator is free to download and is suitable for all forex traders, regardless of experience level.
FAQ
Published:
Dec 08, 2025 08:11 AM
Category: