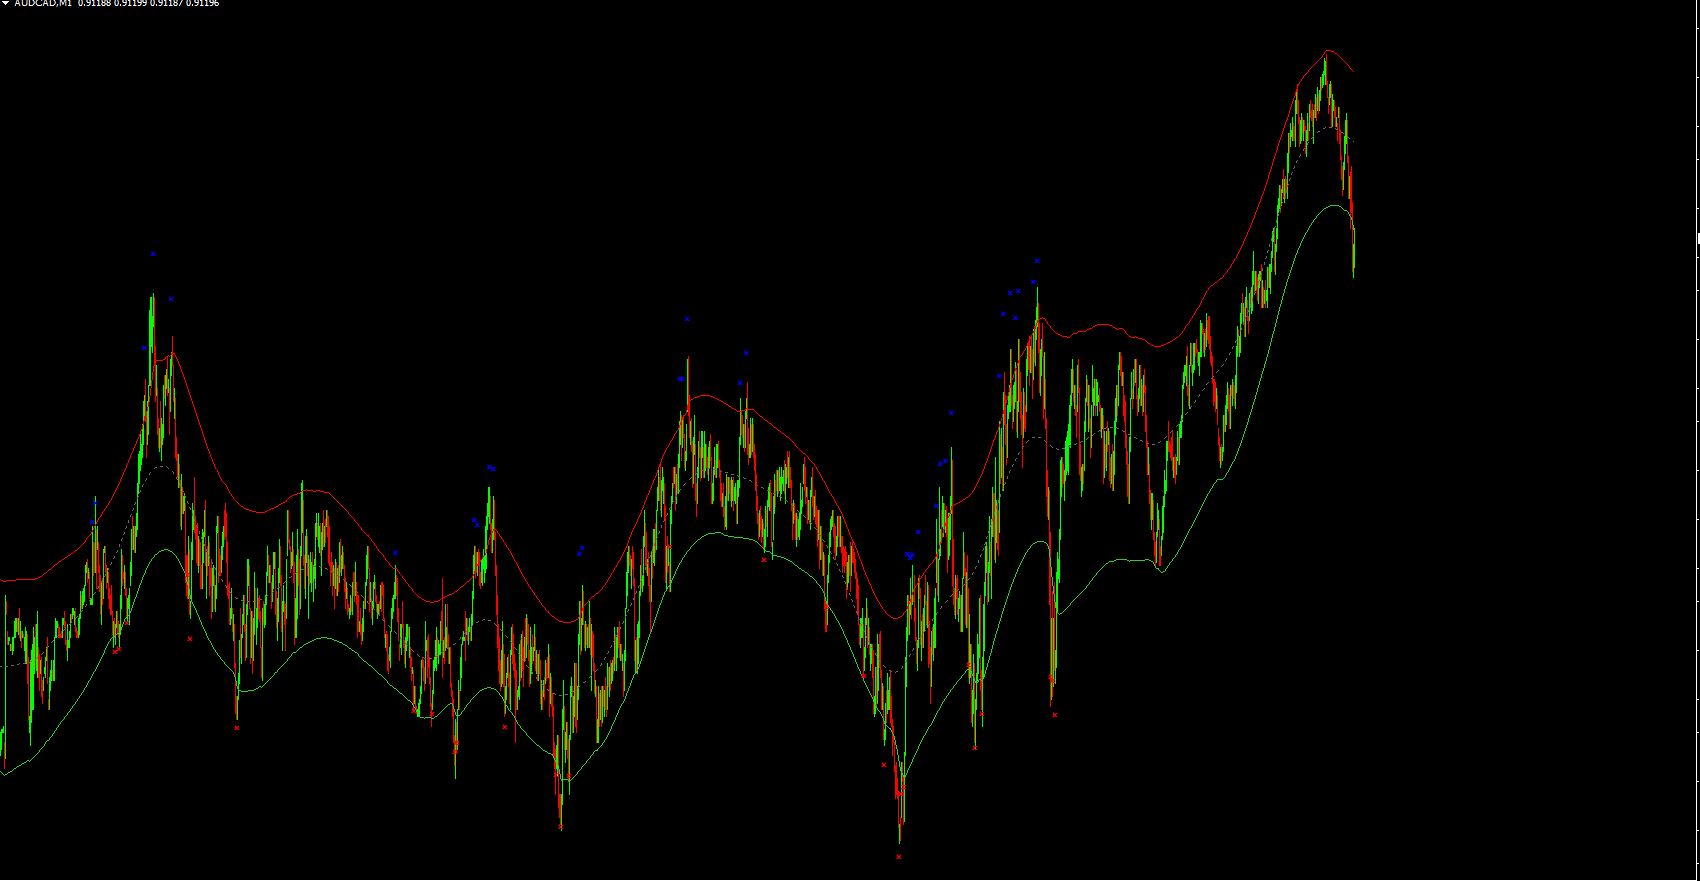
The TMA CG Indicator is a free and popular MT4 forex tool designed to help traders analyze market trends and identify potential price reversals. Built on the True Moving Average (TMA) concept, the TMA CG Indicator smooths price data to provide clearer signals, reducing market noise and highlighting actionable opportunities.
Traders of all experience levels use the TMA CG Indicator for its simplicity and effectiveness. By combining TMA calculations with a smoothed line and histogram, this indicator delivers valuable insights that help traders make informed decisions in both trending and ranging markets.
How the TMA CG Indicator Works
The TMA CG Indicator is based on the True Moving Average (TMA), which averages price over a specified period to smooth out short-term fluctuations. The TMA CG uses a smoothed version of this line to create a more stable signal for potential reversals.
Key components include:
TMA CG Line: A smoothed version of the TMA line, which helps identify trend changes and potential reversals.
Histogram: Shows the difference between the TMA CG line and the TMA line, providing visual confirmation of market momentum and price direction.
By interpreting the relationship between the TMA CG line, TMA line, and histogram, traders can detect early signs of trend exhaustion or reversal points.
Key Features of the TMA CG Indicator
Smoothed TMA Line
The TMA CG line reduces market noise, making it easier to see the overall trend and potential reversal zones.
Histogram Analysis
The histogram displays the gap between the TMA CG line and the original TMA line, highlighting momentum changes and potential trade setups.
Easy to Use
With a clean visual layout and clear signals, the TMA CG Indicator is beginner-friendly and can be quickly added to any MT4 chart.
Free MT4 Tool
The TMA CG Indicator is available for free and provides a reliable way for traders to analyze the market without additional costs.
Benefits of Using the TMA CG Indicator
Identify Potential Reversals
The smoothed TMA CG line combined with the histogram helps traders spot when the trend may be ending or reversing, enabling timely entries or exits.
Reduce Noise in Market Analysis
By smoothing out price fluctuations, the indicator allows traders to focus on meaningful trend movements and avoid reacting to minor price swings.
Enhance Trading Strategy
Traders can combine the TMA CG Indicator with other technical tools such as Support And Resistance levels, oscillators, or trend lines to confirm trade signals and improve accuracy.
Versatile Across Markets
The indicator can be used in trending or ranging markets, making it suitable for forex, commodities, and other trading instruments.
How to Use the TMA CG Indicator Effectively
In Uptrends
During a bullish trend, traders can look for price pullbacks toward the TMA CG line as potential entry points. When the histogram confirms positive momentum, the Trend Continuation can be anticipated.
In Downtrends
In bearish markets, price retracing toward the TMA CG line may provide short-selling opportunities. A negative histogram value confirms selling pressure.
Spotting Reversals
When the histogram begins to shrink or changes direction, it may indicate weakening momentum and an upcoming reversal. This is particularly useful at major support or resistance levels.
Why Use the TMA CG Indicator from IndicatorForest.com?
At IndicatorForest.com, traders can access the TMA CG Indicator along with other professional MT4 tools designed to simplify market analysis and improve trading performance. The indicator is ideal for identifying potential reversals, spotting trends, and enhancing trading decisions.
Call to Action:
Visit IndicatorForest.com today to download the TMA CG Indicator and explore more high-quality forex trading tools to boost your trading strategy.
FAQ
2 Downloads
Published:
Dec 20, 2025 12:25 PM
Category: