The Bigger TF OHLC Indicator is a powerful and free MT4 tool designed to help Forex traders analyze higher timeframe price data directly on a lower timeframe chart. By displaying the open, high, low, and close (OHLC) values of a selected higher timeframe, this indicator makes multi-timeframe analysis faster, clearer, and more efficient.
Multi-timeframe analysis is one of the most important concepts in professional trading. Instead of switching charts repeatedly, the Bigger TF OHLC Indicator allows traders to compare current price action with higher timeframe Market Structure in real time. This improves decision-making and helps traders identify high-probability entry and exit points.
What Is the Bigger TF OHLC Indicator
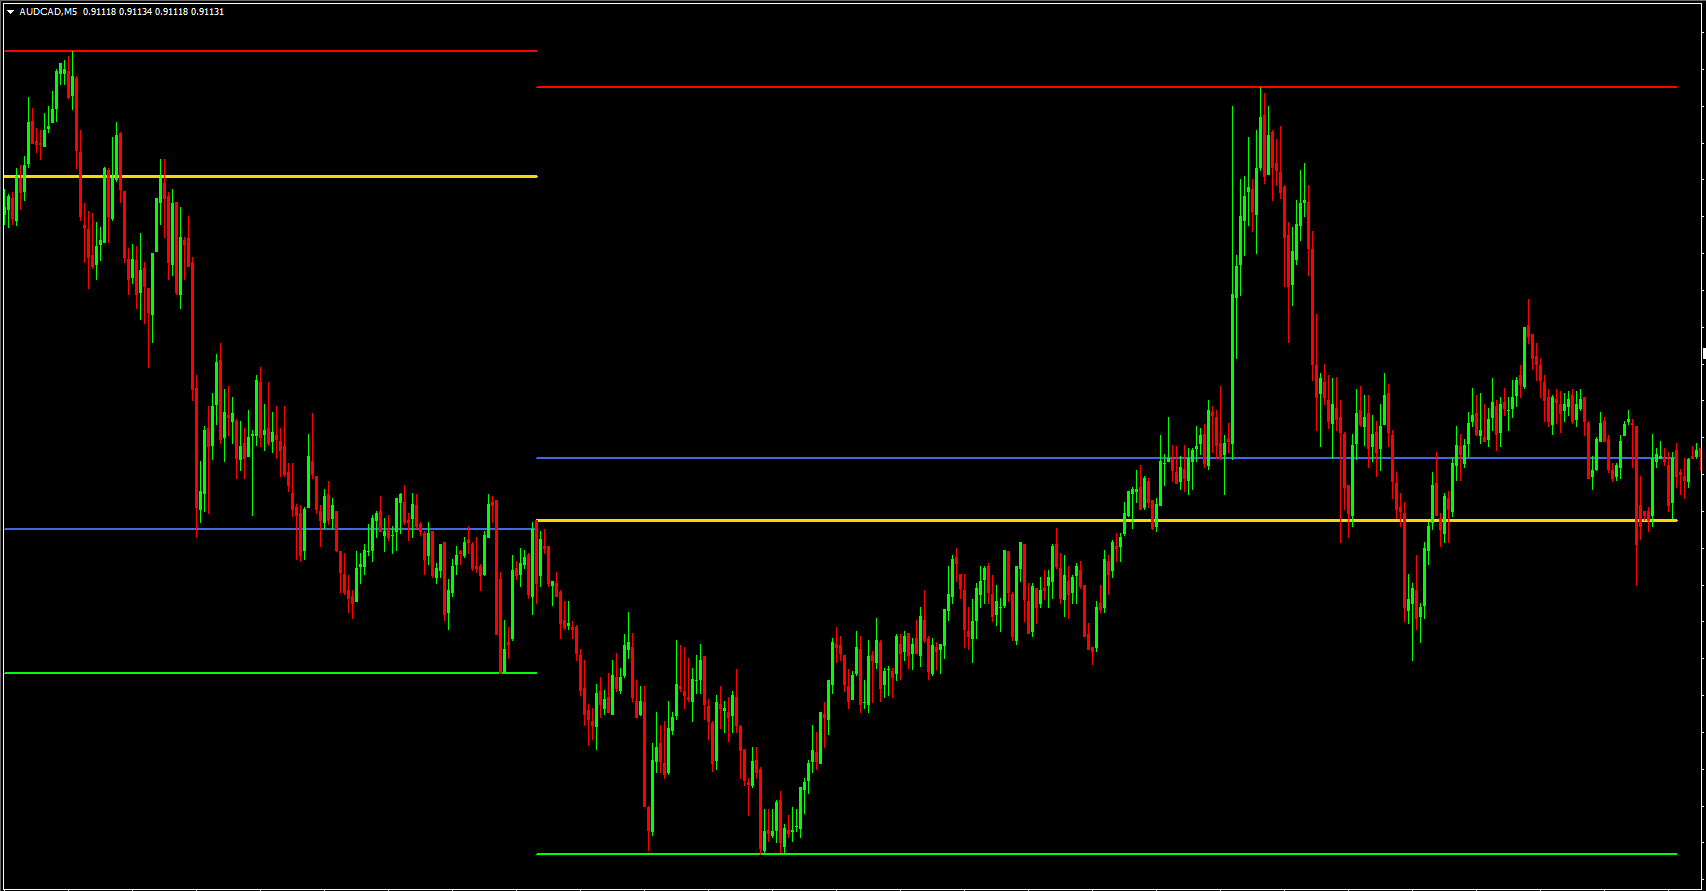
The Bigger TF OHLC Indicator plots the OHLC values of a chosen higher timeframe directly onto the active chart. For example, while trading on a 15-minute or 1-hour chart, traders can instantly view the daily or 4-hour open, high, low, and close levels.
These levels act as key reference points that often influence price behavior. Many institutional traders and algorithms pay close attention to higher timeframe OHLC levels, making them critical areas of interest for retail traders as well.
Core Features of the Indicator
One of the main strengths of the Bigger TF OHLC Indicator is its simplicity combined with effectiveness.
Key features include:
Displays higher timeframe OHLC levels on one chart
Easy timeframe selection through indicator settings
Clear visual representation without clutter
Works on all MT4 currency pairs and timeframes
Lightweight and beginner-friendly
By showing historical price structure alongside current Price Action, traders can better understand how the market is reacting to important levels.
How It Improves Market Analysis
The Bigger TF OHLC Indicator enhances technical analysis by adding higher timeframe context. When price approaches a higher timeframe open, high, low, or close, reactions such as reversals, breakouts, or consolidations are more likely.
This helps traders:
Identify trend direction more accurately
Spot strong Support And Resistance zones
Avoid trading against higher timeframe bias
Improve timing for entries and exits
For example, if price is approaching the previous day’s high, traders may anticipate resistance or a breakout, depending on overall market conditions.
Benefits for Different Trading Styles
The Bigger TF OHLC Indicator is versatile and suitable for multiple trading styles.
Scalpers benefit by avoiding trades into major higher timeframe levels.
Day traders use it to align intraday trades with daily price structure.
Swing traders rely on it to confirm broader market direction and key zones.
By combining lower timeframe precision with higher timeframe awareness, traders gain a balanced and disciplined approach to the market.
Practical Trading Applications
Some common ways traders use the Bigger TF OHLC Indicator include:
Using higher timeframe open levels as intraday bias markers
Trading breakouts above previous highs or below previous lows
Taking profits near higher timeframe close levels
Placing stop losses beyond significant OHLC zones
When combined with other indicators such as trend tools or momentum oscillators, the Bigger TF OHLC Indicator becomes a strong confirmation tool.
Why Use the Bigger TF OHLC Indicator
The biggest advantage of the Bigger TF OHLC Indicator is time efficiency. It eliminates the need to constantly switch between charts while preserving the accuracy of multi-timeframe analysis.
This leads to:
Clearer market structure
Reduced emotional trading
Better trade planning
Improved consistency
If you want to trade with more confidence and clarity, this indicator is an essential addition to your MT4 toolbox.
Explore this and many other professional-grade free indicators by visiting IndicatorForest.com and enhance your trading strategy today.
FAQ
3 Downloads
Published:
Dec 19, 2025 12:55 PM
Category: