Master Intraday Bias with the Daily Open Trading Indicator
In the foreign exchange markets, the start of a new trading day represents more than just a change on the calendar—it marks a complete reset of institutional order flow. For day traders and scalpers, the price level where a currency pair officially opens the day serves as the ultimate line in the sand. The Daily Open indicator for MetaTrader is engineered to track this crucial benchmark automatically, giving retail traders a powerful, objective anchor to determine daily market bias and locate institutional breakout zones.
What is the Daily Open Indicator?
The Daily Open indicator is a structural technical analysis tool that automatically identifies and draws the opening price of the daily candle across your lower-timeframe charts. Instead of forcing you to manually toggle back and forth between timeframes or guess where the session officially began, this utility displays clear, horizontal step-lines that project key intraday Support And Resistance thresholds.
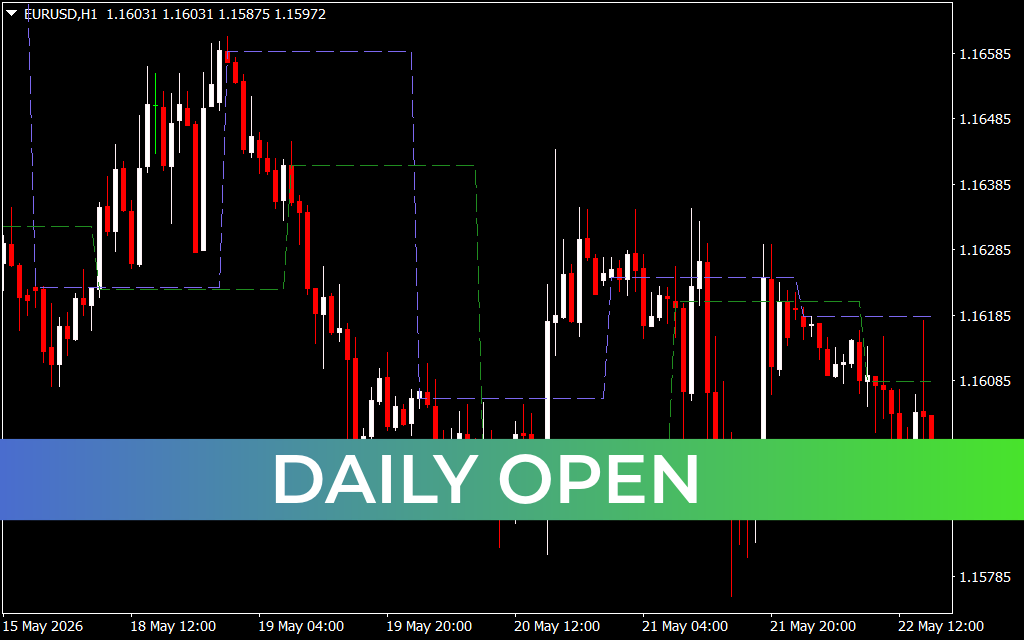
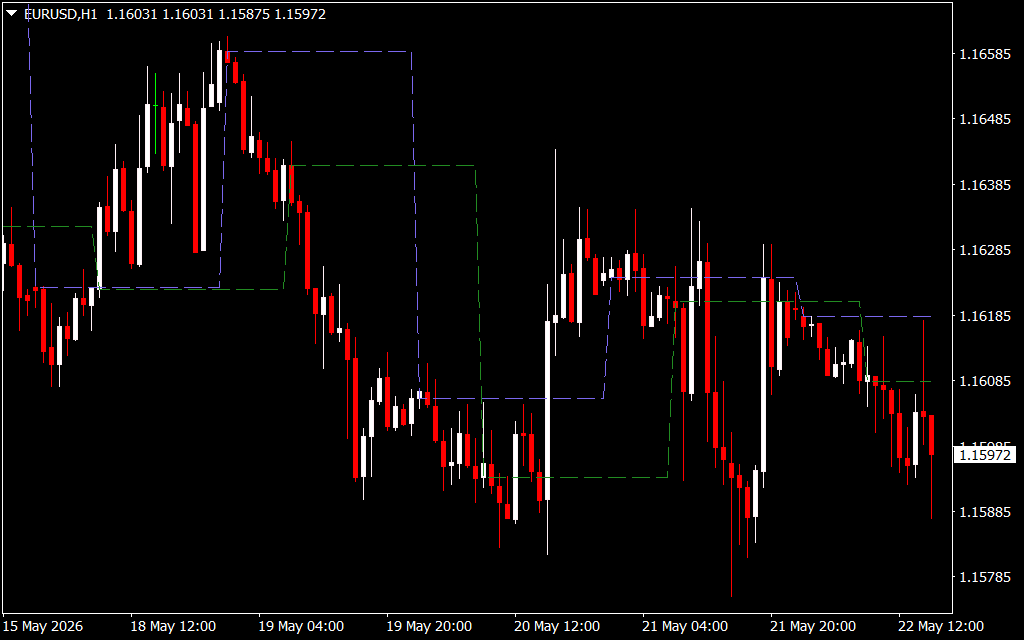
As displayed on the EURUSD H1 chart, the indicator tracks multiple historical daily sessions simultaneously using a clean visual profile:
- Horizontal Step Levels: The indicator projects distinct, color-coded dashed lines (such as the green and purple lines) across the workspace. These lines map out the historical open price for each consecutive 24-hour cycle.
- The Intraday Pivot Line: As price moves throughout the London and New York sessions, it constantly interacts with these levels, treating them as major structural areas where smart money blocks frequently enter the market.
Key Trading Advantages and Features
- Instant Intraday Bias Determination: Provides an immediate rule of thumb for directional bias. When price is trading above the Daily Open, the market is structurally bullish; when it drops below, the market is bearish.
- Automated Support & Resistance: Eliminates the subjectivity of drawing intraday lines, offering clean mathematical targets where price is highly likely to stall, bounce, or aggressively break out.
- Enhanced Risk Management: Gives traders an objective structural level to place protective stop-losses or plan accurate breakout entries.
- Uncluttered Workspace Integration: The clean step-line geometry fits seamlessly over standard candlesticks without obscuring Price Action or conflicting with lower-timeframe oscillators.
How to Build a Strategy Around the Daily Open Level
To extract maximum consistency from the Daily Open tool, integrate its lines into a clear, mechanical execution framework:
- The Intraday Rejection Setup: Watch for price to pull back and test the active daily open line from above or below. A candlestick rejection pattern (such as a long wick spinning top or pin bar) testing a line like 1.16185 confirms that institutions are defending that level, offering a high-probability bounce entry.
- The Breakout Expansion: When a major economic catalyst or volume surge forces price to cross the open line decisively, it triggers a strong momentum shift. For example, a sharp hourly candle closing below the opening level indicates a bearish breakdown toward historical lows (such as the 1.15785 zone).
- Daily Target Calibration: Use historical open lines as natural take-profit zones. If you are trailing a short trade from a previous session peak, the prior day's open level serves as a logical target where profit-taking or minor consolidation is bound to occur.
Last Update:
May 22, 2026 19:54 PM
Published:
Jan 17, 2026 16:44 PM
Category: