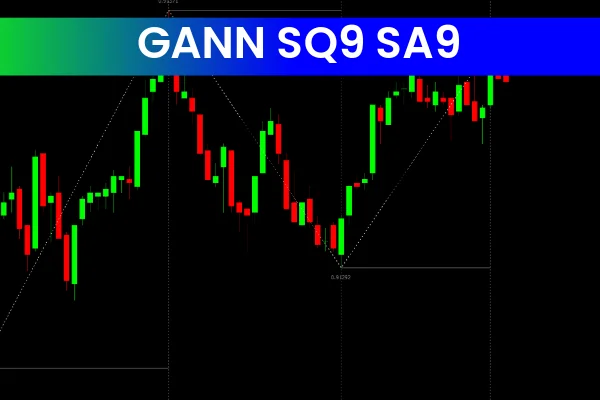
The Gann Sq9 ZigZag Indicator combines two classic MetaTrader tools to provide traders with an automated approach to identifying trend changes and plotting key Support And Resistance levels. By integrating the Gann Square of 9 with the ZigZag indicator, traders can reduce subjectivity and make more precise trading decisions.
Understanding the Gann Sq9 ZigZag Indicator
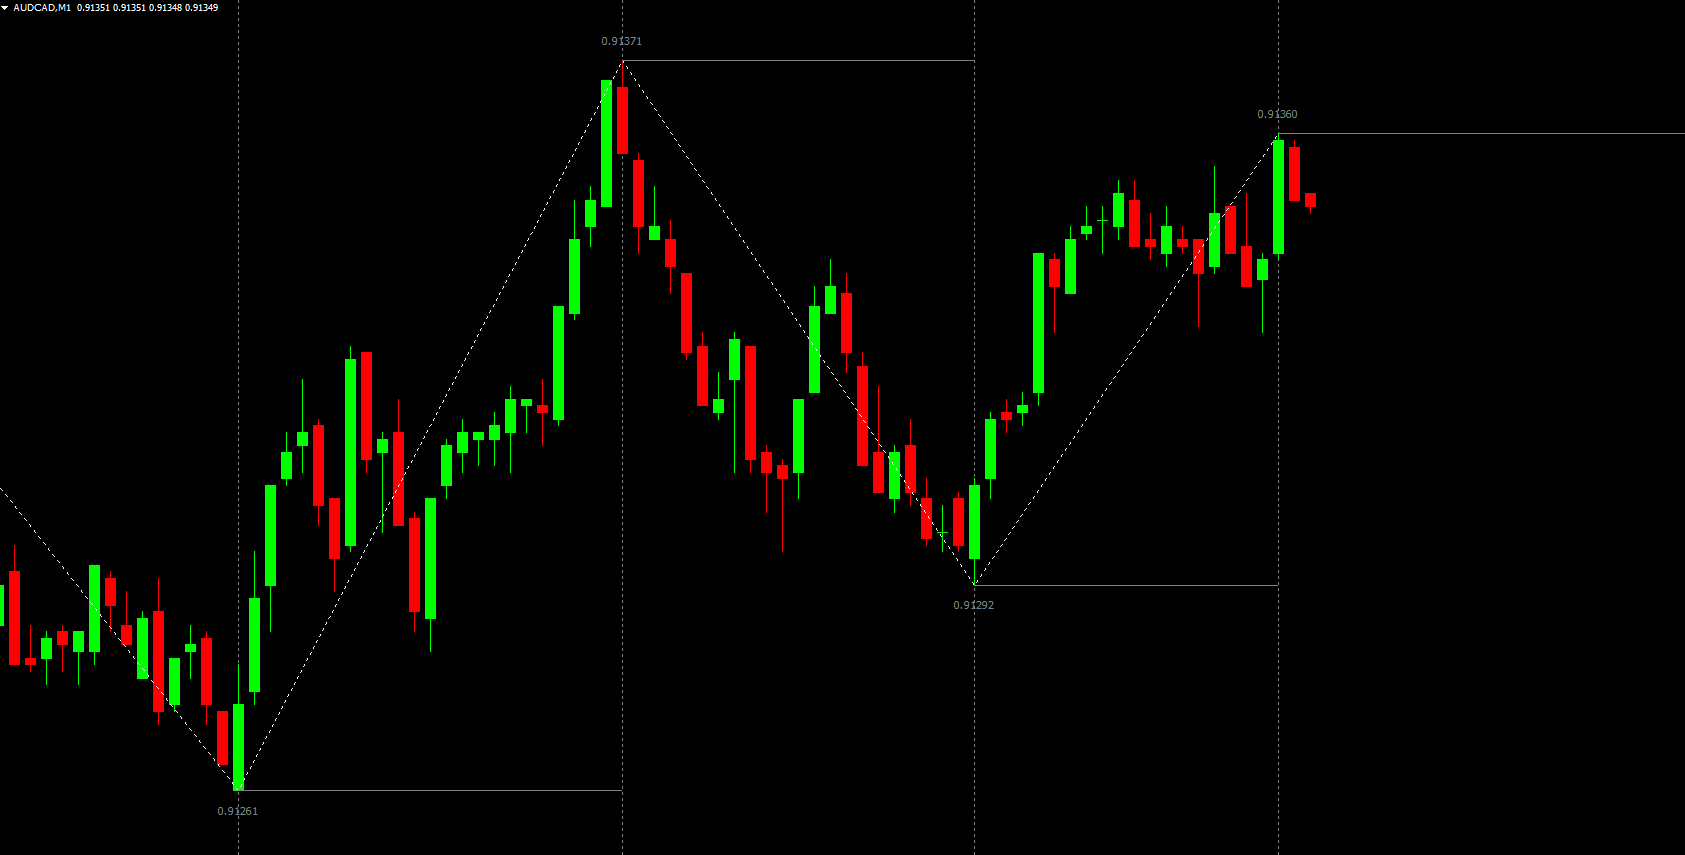
The Gann Sq9 component automatically calculates support and resistance levels based on the Square of 9 principle, eliminating guesswork in identifying price pivots. Meanwhile, the ZigZag indicator highlights significant highs and lows, making trend reversals and market swings easier to spot. When used together, these indicators provide a clear visual framework for trend analysis and decision-making.
Key Features of the Gann Sq9 ZigZag Indicator
Automatic Support and Resistance: Eliminates subjectivity by plotting key levels based on market data.
Trend Change Detection: Quickly identifies potential reversals using ZigZag highs and lows combined with Gann levels.
Improved Accuracy: Helps traders confirm market direction before entering trades.
User-Friendly: Ideal for beginner and advanced traders who want a clear, automated view of the market.
Benefits of Using the Gann Sq9 ZigZag Indicator
Enhanced Trading Performance: Accurate trend and level detection improves entry and exit timing.
Reduced Subjectivity: Automatic plotting removes guesswork and emotional bias.
Versatile Application: Suitable for Scalping, intraday, and swing trading strategies.
Comprehensive Market View: Combines trend analysis and support/resistance levels in a single tool.
How to Maximize the Indicator
For best results, combine the Gann Sq9 ZigZag Indicator with other technical tools like moving averages, RSI, or MACD to confirm trend reversals. Monitor support and resistance levels for breakout or reversal setups to improve trading accuracy.
Download the Gann Sq9 ZigZag Indicator from IndicatorForest.com today to enhance your Forex trading strategy and make smarter, more informed decisions.
FAQ
The Gann Sq9 ZigZag Indicator combines the Gann Square of 9 with the ZigZag indicator to provide an automated approach to identifying trend changes and plotting key support and resistance levels. The Gann Sq9 component automatically calculates support and resistance levels based on the Square of 9 principle, while the ZigZag highlights significant highs and lows.
The Gann Square of 9 automatically calculates support and resistance levels based on mathematical principles, eliminating guesswork in identifying price pivots. These levels are derived from the Square of 9 methodology, providing objective reference points that many traders use for decision-making, making them significant areas where price may react.
Use the automatically plotted support and resistance levels to identify potential entry and exit points. The ZigZag component helps identify trend changes and market swings, making trend reversals easier to spot. Combine both components to confirm market direction before entering trades, using the levels for stop-loss and take-profit placement.
The automatic plotting removes subjectivity and emotional bias by eliminating guesswork. The combination of trend analysis and support/resistance levels in a single tool provides a comprehensive market view, helping traders confirm market direction and improve entry and exit timing with greater accuracy.
For best results, combine the Gann Sq9 ZigZag Indicator with other technical tools like moving averages, RSI, or MACD to confirm trend reversals. Monitor support and resistance levels for breakout or reversal setups to improve trading accuracy. The versatile application makes it suitable for scalping, intraday, and swing trading strategies.
2 Downloads
Published:
Dec 15, 2025 23:10 PM
Category: