In Forex trading, identifying trend shifts and breakout opportunities is essential for consistent performance. The Fiji BB Alert Indicator is a popular and free Forex Indicator for MT4 that closely resembles classic Bollinger Bands, while offering clear visual guidance for traders. This indicator is especially useful for detecting bullish and bearish breakouts, trend exhaustion, and sideways market conditions.
The Fiji BB Alert Indicator is simple, effective, and suitable for traders of all experience levels who want a reliable volatility-based trading tool.
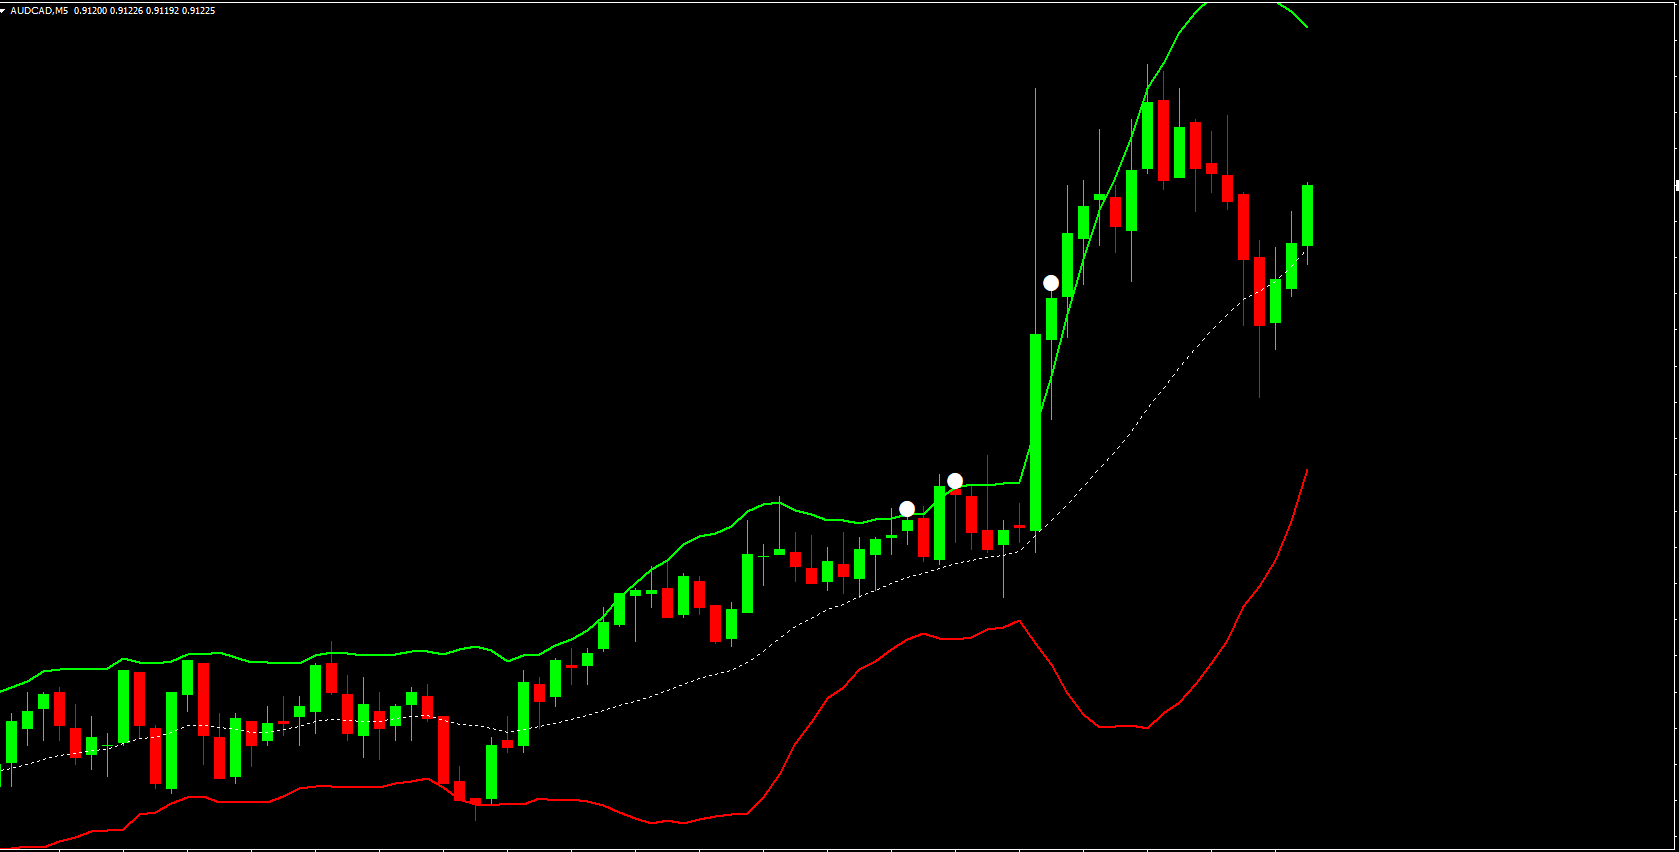
How the Fiji BB Alert Indicator Works
The Fiji BB Alert Indicator consists of three main components:
An upper band
A lower band
A central middle line
These bands expand and contract based on market volatility, just like traditional Bollinger Bands. The indicator monitors price interaction with these bands to identify potential trend reversals, continuations, and breakout zones.
When price moves beyond the bands, it signals potential exhaustion or reversal, giving traders valuable insight into market behavior.
Key Features of the Fiji BB Alert Indicator
Bollinger Band Structure
The indicator mirrors the classic Bollinger Bands setup, making it easy to understand for traders already familiar with volatility-based indicators.
Works on All Timeframes
The Fiji BB Alert Indicator performs effectively on all chart timeframes, from Scalping charts to higher timeframes used in swing and position trading.
Market Noise Reduction
When combined with indicators like RSI or MACD, the Fiji BB Alert Indicator helps reduce false signals and market noise.
Clear Market State Identification
The middle band highlights neutral market conditions, helping traders recognize sideways or ranging markets.
How the Fiji BB Alert Indicator Can Benefit You
The Fiji BB Alert Indicator MT4 provides traders with clear trade entry and exit signals based on price behavior around the bands.
When the price breaks above the upper band, it suggests the current uptrend may be overextended. Traders may consider closing long positions and preparing for potential short setups.
Conversely, when the price breaks below the lower band, it often signals that the downtrend is nearing exhaustion. This creates an opportunity to take profits on sell trades and potentially enter long positions.
When price moves near the central line, it reflects a neutral or sideways market, warning traders to avoid low-probability trades during consolidation phases.
Trading Strategies Using the Fiji BB Alert Indicator
Breakout Reversal Strategy
Use band breakouts near key support or resistance levels as potential reversal zones, confirming with Price Action or momentum indicators.
Trend Exhaustion Strategy
Extreme price movements outside the bands may indicate weakening momentum, allowing traders to plan exits or countertrend trades.
Indicator Confluence Strategy
Combining the Fiji BB Alert Indicator with RSI, MACD, or volume indicators improves signal reliability and trade accuracy.
Why Traders Choose the Fiji BB Alert Indicator
Traders prefer the Fiji BB Alert Indicator because it is simple, reliable, and versatile. Its familiar Bollinger Band structure makes it easy to use, while its ability to highlight breakouts and trend exhaustion helps traders make better-informed decisions.
For more high-quality MT4 indicators and Forex trading tools, visit IndicatorForest.com, your trusted source for professional Forex indicators.
FAQ
The Fiji BB Alert Indicator closely resembles classic Bollinger Bands, consisting of an upper band, lower band, and central middle line. These bands expand and contract based on market volatility, helping traders detect bullish and bearish breakouts, trend exhaustion, and sideways market conditions through price interaction with the bands.
When price breaks above the upper band, it suggests the uptrend may be overextended - consider closing long positions and preparing for short setups. When price breaks below the lower band, it signals downtrend exhaustion - take profits on sell trades and potentially enter long positions. Price near the central line reflects neutral or sideways markets.
While the indicator mirrors the classic Bollinger Bands setup, it offers clear visual guidance and alert functionality that helps traders identify breakouts and trend exhaustion more effectively. When combined with indicators like RSI or MACD, it helps reduce false signals and market noise compared to using Bollinger Bands alone.
Use band breakouts near key support or resistance levels as potential reversal zones, confirming with price action or momentum indicators. Extreme price movements outside the bands may indicate weakening momentum, allowing you to plan exits or countertrend trades. Combine with RSI, MACD, or volume indicators for improved signal reliability.
The indicator performs effectively on all chart timeframes, from scalping charts to higher timeframes used in swing and position trading. It is simple, effective, and suitable for traders of all experience levels who want a reliable volatility-based trading tool across different market conditions.
Published:
Dec 18, 2025 09:59 AM
Category: