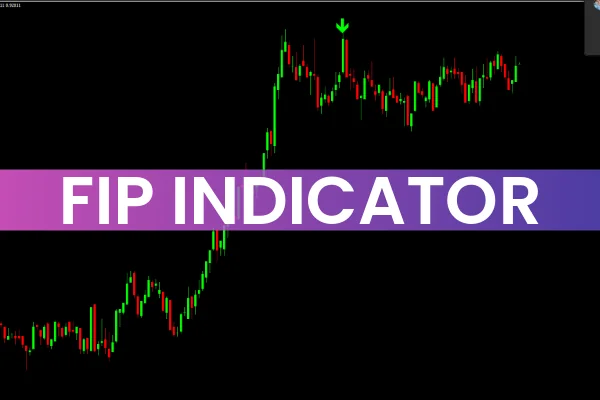
The FIP Indicator is a powerful MT4 tool that uses standard deviations to plot green arrows, signaling potential bullish or bearish reversals at the end of a trend. By highlighting these turning points, the indicator helps traders identify key reversal opportunities and plan precise entries and exits.
Although the FIP Indicator works on all timeframes, it is most effective on longer-term charts, reducing the number of false signals often seen in shorter timeframes.
How the FIP Indicator Works
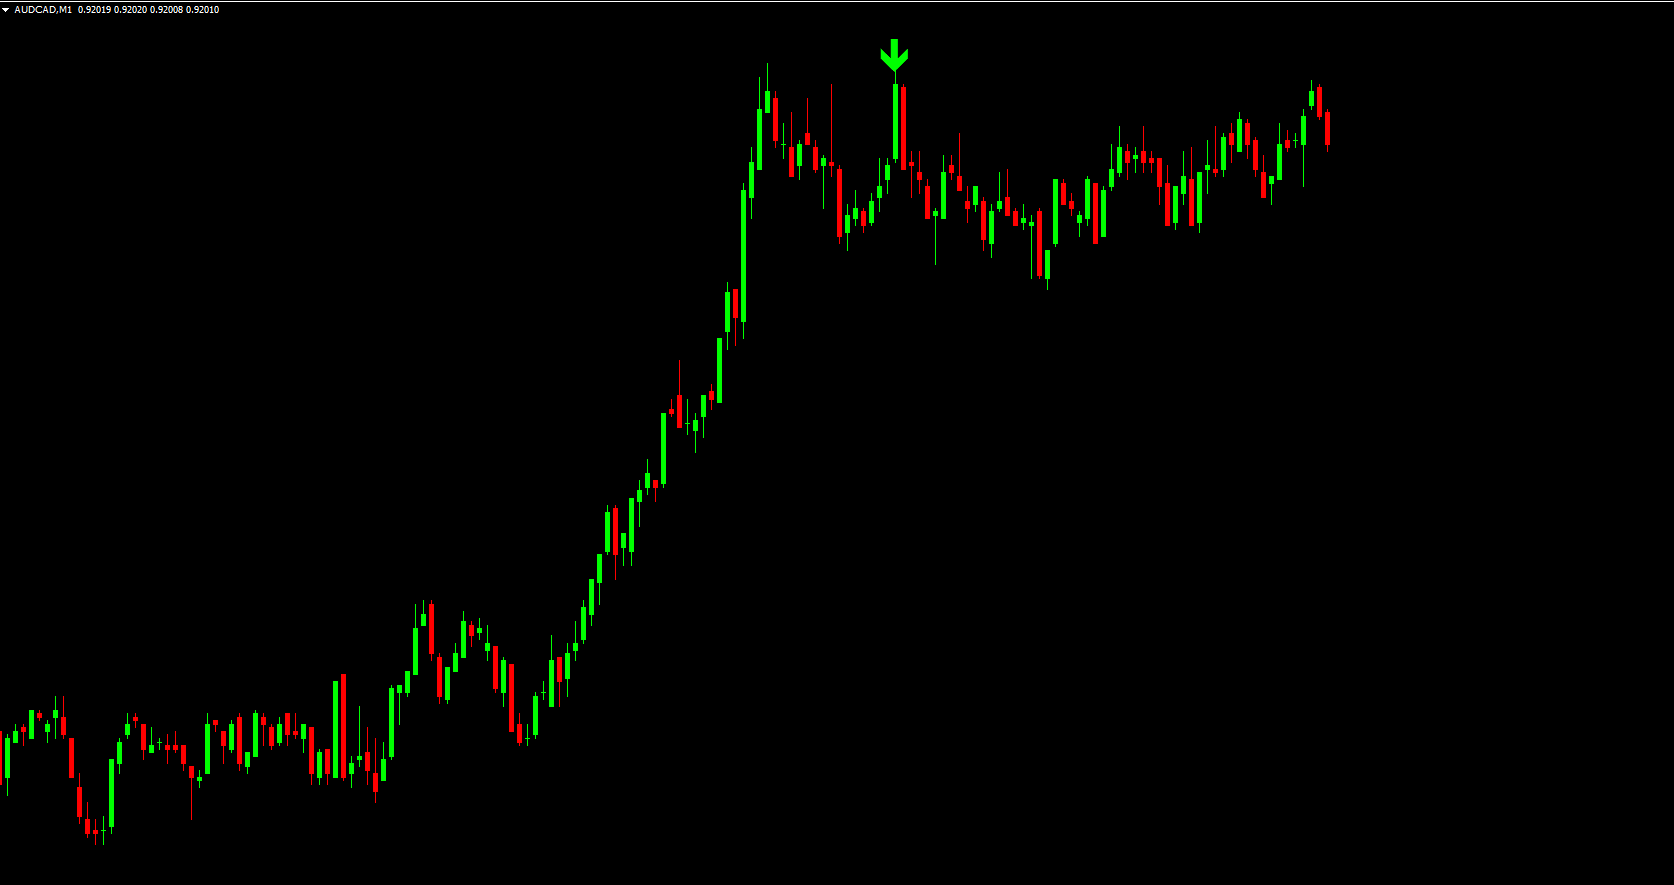
The FIP Indicator plots arrows directly on the MT4 chart:
Bullish Reversal: An arrow appears at the end of a downtrend, indicating a potential upward reversal.
Bearish Reversal: An arrow forms at the end of uptrend, signaling a possible downward reversal.
These arrows are non-repainting, meaning they stay on the chart once plotted, allowing traders to review past signals and improve strategy analysis.
Trading Tips
Confirm Arrows with Technical Analysis: Combine FIP signals with other indicators or support/resistance levels to reduce false signals.
Longer Timeframes: Use H4, H1, or daily charts for more reliable signals. Shorter timeframes may generate multiple, less reliable arrows.
Trade Exit Strategy: Consider exiting a trade when the next arrow appears, signaling a potential Trend Reversal.
Risk Management: Always apply stop-loss and position sizing based on market volatility and trend strength.
Benefits of the FIP Indicator
Highlights bullish and bearish reversals with clear arrows
Works on all timeframes, but optimized for longer-term charts
Non-repainting arrows allow for historical analysis
Supports better entry and exit timing
Suitable for forex, stock, and commodity trading
Conclusion
The FIP Indicator for MT4 is an easy-to-use tool for identifying potential market reversals. Its green arrows, plotted using standard deviations, provide clear guidance for bullish and bearish turns, helping traders make informed decisions. For optimal results, combine FIP with other technical analysis tools to confirm trades.
Download the FIP Indicator today from IndicatorForest.com and improve your trend reversal analysis.
FAQ
10 Downloads
Published:
Nov 13, 2025 03:41 AM
Category: