Avoiding the Choppy Squeeze: Mastering Range Filters with the Flat Trend V2 Indicator
One of the most frequent traps for retail forex day traders and scalpers is executing positions inside a flat market. While trending strategies work exceptionally well when an asset experiences strong directional expansion, they break down completely during low-volatility consolidation. Trading indicators that perform brilliantly in a trending environment can quickly generate a rapid succession of false breakouts when the market squeezes, leading to frustrating account drawdown. The Flat Trend V2 Indicator for MT4/MT5 tackles this engineering hurdle directly, offering a pristine, multi-color sub-window histogram designed specifically to isolate flat ranges and spot valid trend continuations.
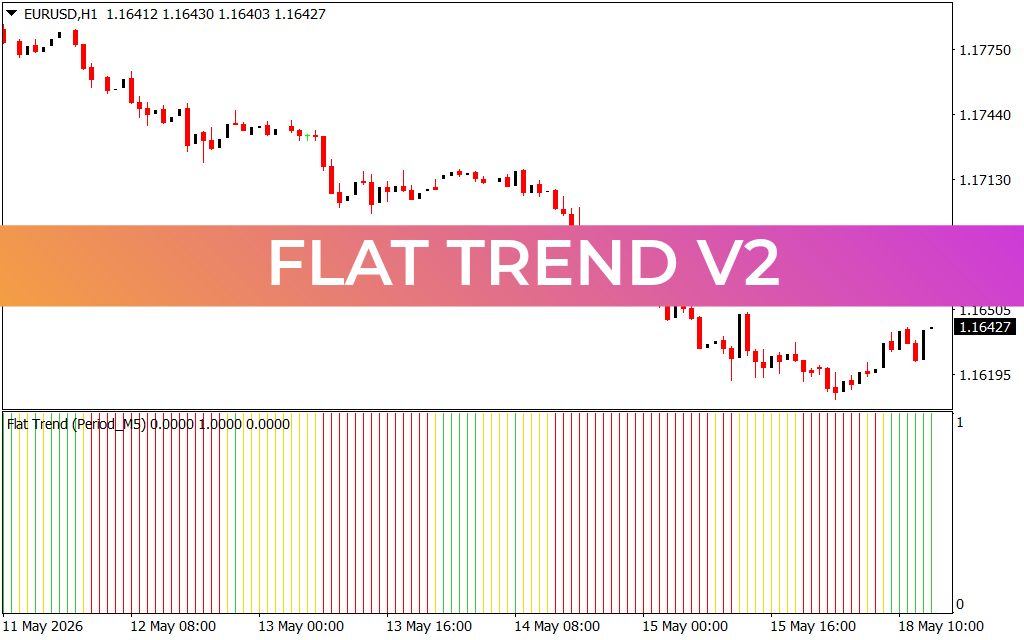
Deciphering Volatility States on the EUR/USD H1 Chart
The provided EUR/USD 1-hour (H1) chart demonstrates how the Flat Trend V2 indicator functions as an objective structural filter over multi-day trading sessions. Positioned in the sub-window beneath the main chart field, the indicator translates complex price deviations and momentum cycles into a highly readable, dual-color horizontal histogram grid.
During the initial multi-day phase starting on May 11, the currency pair initiated a systematic distribution markdown, tumbling away from the 1.17750 liquidity pool. As the bearish momentum accelerated through the 1.17190 support zone, the Flat Trend V2 histogram printed a sequence of solid red bars. This uniform coloring alerts technical traders that a powerful downward trend is active, signaling that short positions are highly favored while warning against trying to buy the dip prematurely.
Following this heavy markdown phase, the asset reached a selling climax near the 1.16195 area on May 15, moving into a prolonged accumulation and consolidation phase over the weekend. In a standard charting setup, a drifting sideways structure can easily trigger erratic momentum signals.
Notice how the Flat Trend V2 engine reacts to this sideways compression: the histogram bars flip cleanly to blue. In Flat Trend technical theory, the blue blocks signify a neutralized, flat trend state. This distinct signature warns trend-following algorithms and retail day traders to stand aside, saving valuable capital from being chopped up inside a narrow trading band.
Capturing Breakouts with Complete Precision
The true tactical utility of the Flat Trend V2 indicator unfolds when the price successfully breaks out of a low-volatility squeeze to initiate a fresh trend lifecycle. During the morning session on May 18, the EUR/USD pair gathered sufficient buying liquidity to challenge overhead structural resistance.
As the price aggressively expanded upward past the 1.16354 pivot level, the histogram bars in the sub-window reacted instantly, shifting out of the neutral blue posture back into a solid trend configuration. Currently trading near 1.16433, the indicator provides immediate confirmation that buyers have reclaimed market velocity.
By incorporating the Flat Trend V2 indicator into your daily technical workspace, you eliminate subjective guesswork from range analysis. It arms you with a clean, algorithmic filter to avoid overtrading during flat market conditions, manage risk accurately by setting tight stop-losses beneath localized consolidation boundaries, and confidently catch massive expansion waves the exact moment true institutional volume returns to the market.
4 Downloads
Last Update:
May 18, 2026 17:02 PM
Published:
Jan 19, 2026 21:37 PM
Category: