Conquering Multi-Timeframe Markets: The Fpm Trend Power Indicator
For retail traders, one of the most frequent reasons a technical setup fails is trading against the higher-timeframe tide. A strategy might point to a perfect buy setup on a 1-minute (M1) chart, but if institutional players are aggressively liquidating positions on the 1-hour (H1) or Daily (D1) screens, that small-scale long trade will quickly get overrun. Manually checking multiple timeframes before clicking execution buttons adds significant cognitive friction and causes costly entry delays. The Fpm Trend Power indicator eliminates this bottleneck by condensing multi-timeframe directional strength into a single, real-time dashboard layout.
By evaluating structural momentum matrices simultaneously across a variety of chart intervals, this crucial technical utility gives you an immediate bird’s-eye view of pure market velocity.
Decoding the Matrix: Color-Coded Structural Alignment
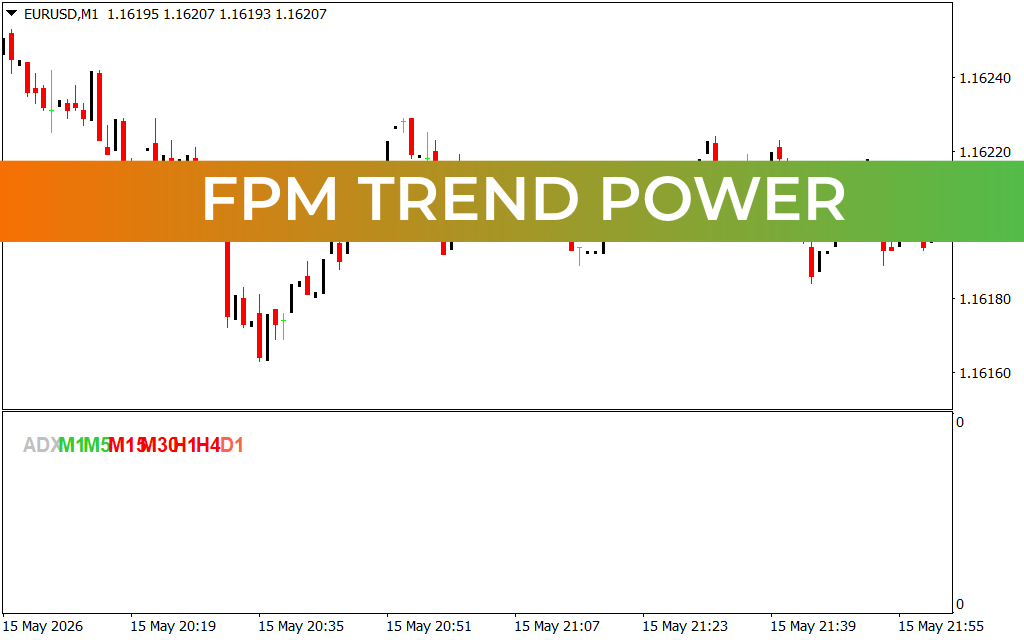
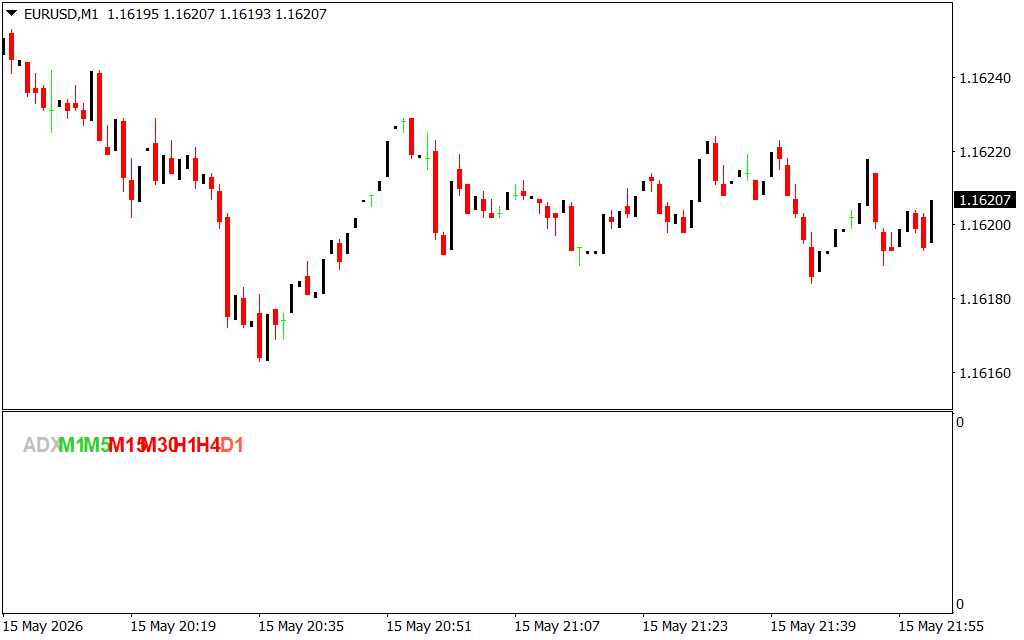
The indicator operates out of a clean, optimized sub-window directly below your primary candlesticks. It displays a real-time layout tracking major trading intervals—such as M1, M5, M15, M30, H1, H4, and D1—using highly intuitive visual color schemes based on underlying Average Directional Index (ADX) metrics and moving averages:
- Aggressive Bullish Momentum (Green Text): When an interval lights up in vibrant green, it confirms that bulls maintain clear structural control on that specific timeframe. High-frequency scalpers look for multiple short-term labels (like M1 and M5) to turn green to validate immediate, rapid long entries.
- Dominant Bearish Extensions (Red Text): Conversely, a bold red label indicates heavy institutional selling pressure. If longer-term parameters (such as H1, H4, and D1) are deeply locked in red, it signals a dominant macro downtrend. In this scenario, any temporary upward move on lower timeframes should be heavily scrutinized as a potential trap.
- The Equilibrium Squeeze (Grey/Neutral Labels): When specific timeframes display a neutral grey tone, it proves that the asset is currently trapped in a low-liquidity accumulation or distribution phase, warning you that directional velocity is drying up.
Engineered for Multi-Timeframe Scalping Systems
The Fpm Trend Power utility is an invaluable addition to fast-paced trading systems like 5-minute Scalping or sixty-second micro-trades. When trading liquid currency pairs like the EUR/USD, catching high-probability trends requires absolute structural alignment.
Instead of flipping back and forth between screens, you simply look at the dashboard. The ultimate high-probability setup occurs during full confluence: when lower-timeframe execution charts align perfectly with the macro trend power filters. If the H1 and H4 labels are red, and your M1 entry setup transitions to red as well, you have mathematical confirmation that big money is driving the move. By pairing this real-time trend dashboard with your standard Price Action routines, you clean up your workspace and protect your capital from choppy, counter-trend market conditions.
1 Download
Last Update:
May 17, 2026 16:23 PM
Published:
Jan 20, 2026 16:09 PM
Category: