Master Market Structure with the Fractal Supp And Res Indicator
Identifying key turning points in the financial markets is often the difference between a winning trade and a costly mistake. For many traders, manual Support And Resistance drawing is subjective, inconsistent, and prone to emotional bias. The Fractal Supp And Res indicator for MetaTrader is a professional-grade solution designed to bring objective, mathematical precision to your technical analysis by automating the identification of critical Supply And Demand zones.
The Science of Fractals in Trading
At its core, a fractal is a geometric pattern that repeats across all scales. In the context of trading, fractals represent high-probability reversal points where the market has reached a temporary exhaustion. A bullish fractal identifies a structural low, while a bearish fractal identifies a structural high.
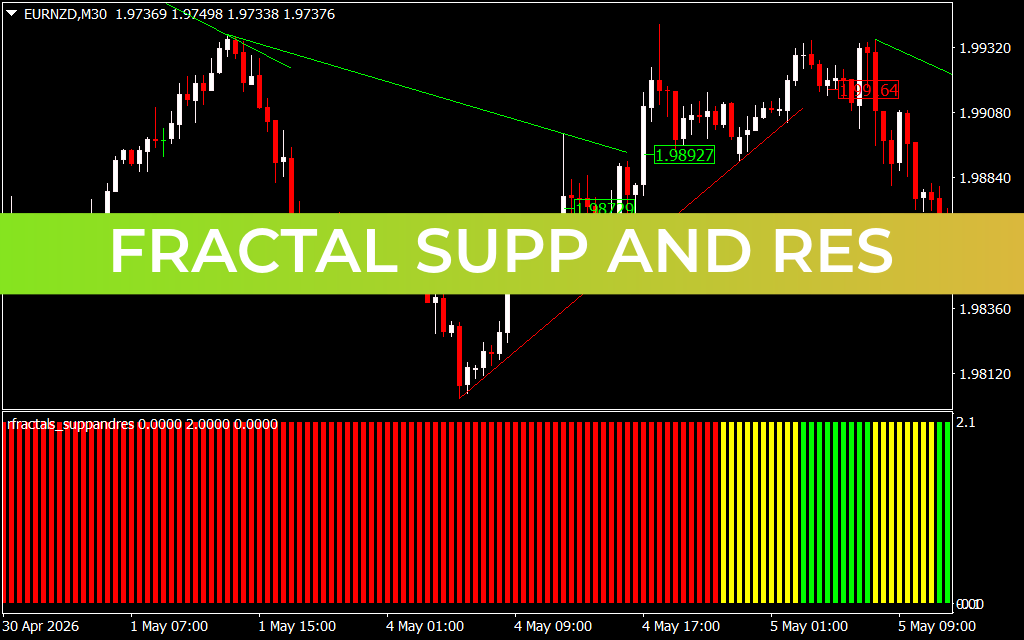
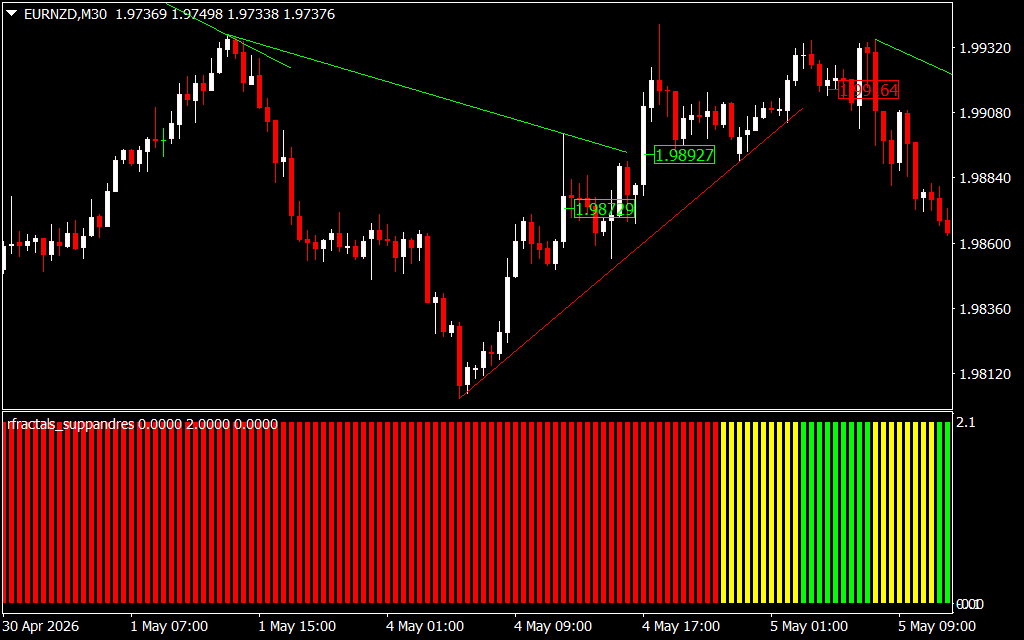
The Fractal Supp And Res indicator takes these raw data points and transforms them into actionable intelligence. As demonstrated in the EURNZD M30 chart, the indicator identifies significant structural pivots and automatically projects trend lines and horizontal levels based on these fractals. This creates a clear visual framework of the current market environment.
Key Features and Advantages
This indicator is more than just a simple drawing tool; it is a comprehensive Market Structure analyzer. Its primary features include:
- Automated Trend Line Construction: The indicator connects recent fractal highs and lows with precise trend lines (shown in green and red), helping you visualize the current trajectory of Price Action without manual guesswork.
- Dynamic Price Labels: Key resistance and support levels are labeled with specific price points, such as 1.98927 or 1.98729, allowing for precise pending order placement.
- Sentiment Visualization: The sub-window features a high-density histogram that color-codes market sentiment. Deep red bars indicate sustained bearish pressure, while the transition to yellow and green signals a shift toward bullish momentum or consolidation.
- Multidimensional Analysis: By combining horizontal price levels with sloped trend lines, the indicator helps traders identify "confluence zones"—areas where multiple technical factors align to create a high-probability trade setup.
Strategic Implementation
The Fractal Supp And Res indicator is particularly effective for breakout and retest strategies. When price action breaks above a fractal resistance line (green), it often signals a shift in market structure from bearish to bullish. Conversely, a break below a red support line suggests further downside potential.
Furthermore, the sentiment histogram in the sub-window acts as a vital filter. A trader might look for a long entry only when the price breaks a fractal resistance line and the histogram begins shifting from red to green, ensuring they are trading in the direction of the underlying momentum.
Conclusion
The Fractal Supp And Res indicator is an essential utility for any trader looking to move beyond basic chart patterns. By automating the identification of support, resistance, and market sentiment, it provides a consistent and objective "road map" for the MT4 or MT5 terminal. Download this professional tool today to start trading with the clarity and confidence of an institutional analyst.
4 Downloads
Last Update:
May 08, 2026 01:51 AM
Published:
Jan 25, 2026 22:57 PM
Category: