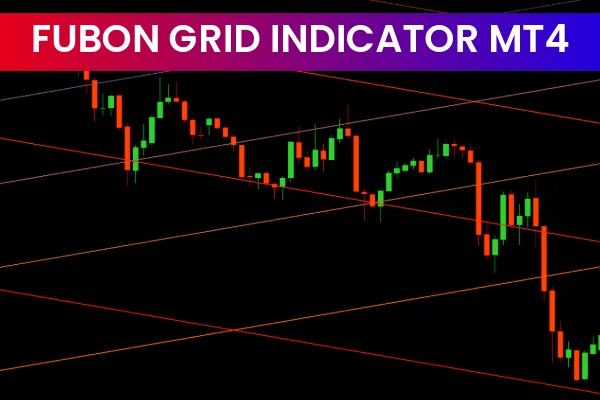
The Fubon Grid Indicator MT4, based on Fibonacci mathematics, is a powerful technical analysis tool that automatically overlays Fibonacci-structured grids on price charts. The indicator helps traders view market structure, trend channels, dynamic Support And Resistance zones, and reversal areas clearly—without manually drawing Fibonacci retracements or levels. This makes it valuable for forex, indices, commodities, metals, and cryptocurrency traders seeking structure and precision in their trading decision-making.
How the Fubon Grid Indicator MT4 Works
The indicator applies Fibonacci ratios such as 0.382, 0.500, 0.618, 1.00, and 1.618 to divide price ranges into strategic grid zones. These levels reflect natural market behavior, as Fibonacci ratios have been used in technical trading for decades to forecast turning points, impulse moves, and market equilibrium.
Once installed, the Fubon Grid Indicator MT4 automatically draws scalable diagonal and horizontal channels across the chart. These grid channels expand or contract depending on market volatility and Trend Strength, giving a clear visualization of trend bias and key reaction points.
This structure helps traders:
Detect developing trend channels
Identify powerful reversal levels
Confirm breakout areas
Track price rhythm based on Fibonacci geometry
Instead of manually plotting Fibonacci tools, this automated grid saves time and increases accuracy.
Fibonacci Grid Trading Signals
Unlike standard trading tools that generate arrows or alarms, the Fubon Grid Indicator MT4 provides visual reaction-based trading signals, allowing traders to make decisions based on price behavior and structure.
Key reaction elements include:
Upper & Lower Fibonacci Grid Lines
Serve as channel boundaries. Price respecting these levels repeatedly signals a strong ongoing trend.
Mid-Level Grid Zones
Often act as equilibrium or pullback points where price may pause before continuing in the trend direction.
Breakouts and Retests
When price breaks beyond a major Fibonacci grid level, it may signal a continuation phase or new trend formation.
This approach makes the indicator ideal for breakout traders, trend followers, and reversal traders who rely on confluence and structure-based entries.
Best Practices for Using the Fubon Grid Indicator MT4
To maximize performance, combine the indicator with supporting tools and market logic:
Trend confirmation: Apply moving averages (MA50, MA200) or ADX.
Confluence: Align Fibonacci grid levels with support/resistance or supply/demand zones.
Multi-timeframe analysis:
Higher timeframes (H1–D1) for trend bias
Lower timeframes (M15–M30) for precise entries
Avoid clutter: Adjust spacing and visual scaling for clean analysis.
Following these steps helps eliminate noise and builds a reliable rule-based framework.
Why Traders Prefer the Fubon Grid Indicator MT4
The indicator stands out because it is:
Fully automatic
Non-repainting after candle close
Clear and easy to interpret
Multi-asset and multi-timeframe compatible
Ideal for trend, breakout, and reversal strategies
Technical traders who rely on market geometry, Fibonacci mathematics, and structured price movement will especially benefit from this tool.
Conclusion
The Fubon Grid Indicator MT4 is a professional Fibonacci-based analysis tool designed to simplify trend mapping and precision trading. Whether you are Scalping or swing trading, it provides a reliable structural framework that improves clarity, timing, and confidence.
You can download this indicator free and explore more MT4 tools at IndicatorForest.com.
FAQ
4 Downloads
Published:
Dec 08, 2025 20:38 PM
Category: