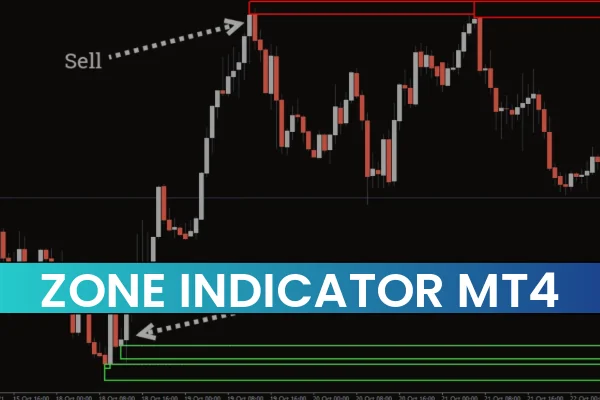
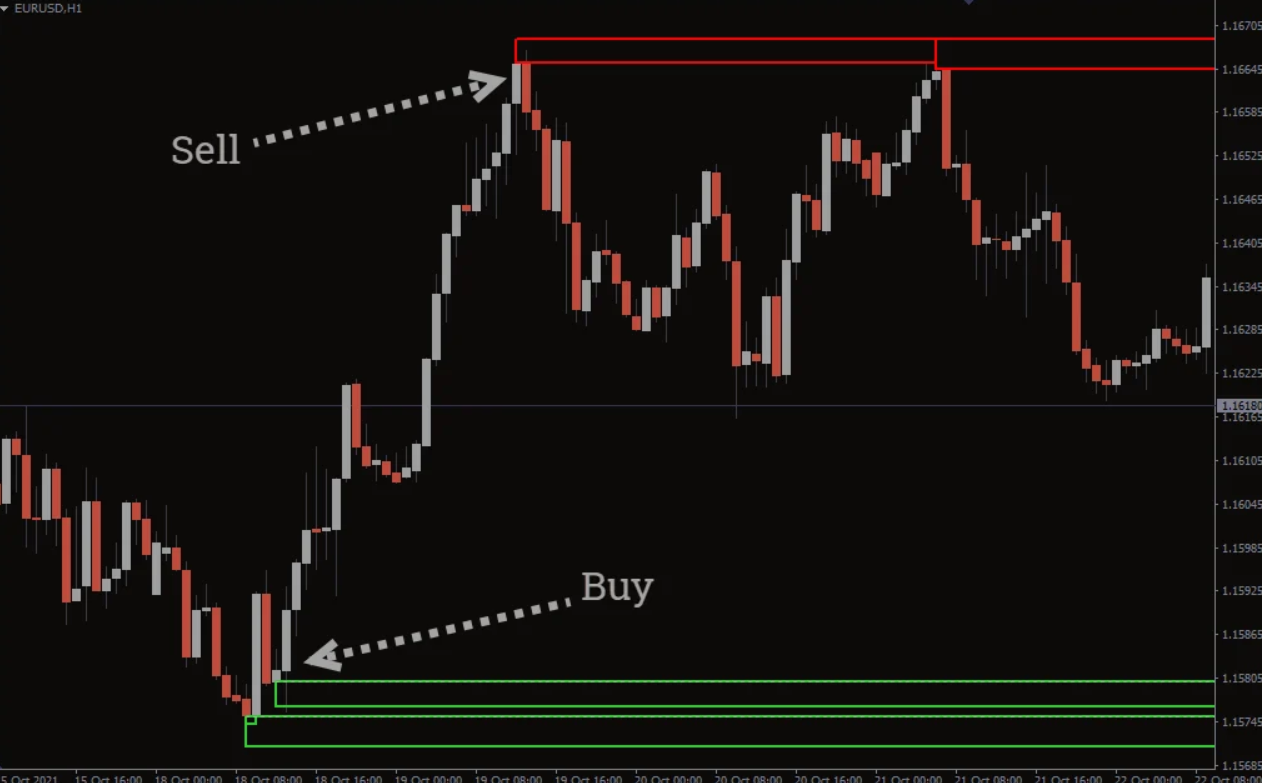
The Zone Indicator for MT4 is a powerful forex trading tool designed to automatically plot strong Support And Resistance zones on your chart. Support and resistance levels are critical in forex trading, as they indicate where price is likely to reverse or stall. This indicator simplifies technical analysis by identifying zones with a high probability of being respected by price, allowing traders to make informed decisions quickly.
Whether you are a novice trader learning how to identify key market levels or a professional trader looking to save time, the Zone Indicator helps remove the guesswork involved in manually drawing pivotal levels every day.
How the Zone Indicator Works
The Zone Indicator highlights key market levels using colored horizontal bars:
Green bars: Indicate potential support zones where the price may bounce upward.
Red bars: Indicate potential resistance zones where the price may reverse downward.
These zones are dynamic and automatically adjust as new price data emerges. Traders can use these zones to determine buy and sell entry points, stop-loss placement, and exit strategies.
The indicator works on all timeframes but is most accurate on higher timeframes, making it suitable for swing trading, day trading, and intraday strategies. It can also be used in Scalping strategies when combined with Price Action confirmation.
Trading Strategies with the Zone Indicator
The Zone Indicator can be used as a stand-alone tool or in combination with price action analysis to improve trade accuracy.
Buy Setup
Wait for the Zone Indicator to paint a potential support level (green bar).
Observe price retracing back to the support zone.
Look for candlestick rejection signals, such as long wicks, indicating the level is holding.
Confirm with a bullish candle close before entering a BUY/LONG trade.
Set stop-loss slightly below the support zone and target exit near the next resistance.
Sell Setup
Wait for the Zone Indicator to plot a potential resistance level (red bar).
Observe price retracing back to the resistance zone.
Look for candlestick rejection, such as upper wicks, signaling the level is respected.
Confirm with a bearish candle close before entering a SELL/SHORT trade.
Set stop-loss slightly above the resistance zone and target exit near the next support.
Key Tip: Always wait for candlestick rejection as confirmation before entering trades. This increases the probability of a successful trade and helps avoid false signals.
Benefits of the Zone Indicator
Automatic plotting: Saves time compared to manually identifying levels.
Supports multiple strategies: Works with scalping, intraday, swing trading, and trend trading.
Dynamic levels: Zones adjust as new price data forms.
Easy for beginners: Helps novice traders understand key market levels.
Free to download: Accessible to all MT4 users.
Limitations
While powerful, the Zone Indicator is not a holy grail. Not all signals are tradable, and price may sometimes break through a zone. Traders should combine this indicator with price action, trend analysis, or other confirmation tools to improve reliability.
Conclusion
The Zone Indicator for MT4 is an essential tool for forex traders who rely on support and resistance strategies. It simplifies trading by automatically identifying key market zones, providing traders with potential buy and sell entries, stop-losses, and exit points. Although not foolproof, when used in conjunction with candlestick rejection and price action confirmation, the indicator can significantly enhance trading accuracy.
For free downloads and more advanced trading tools, visit IndicatorForest.com to upgrade your forex trading strategy today.
FAQ
8 Downloads
Published:
Dec 02, 2025 00:17 AM
Category: