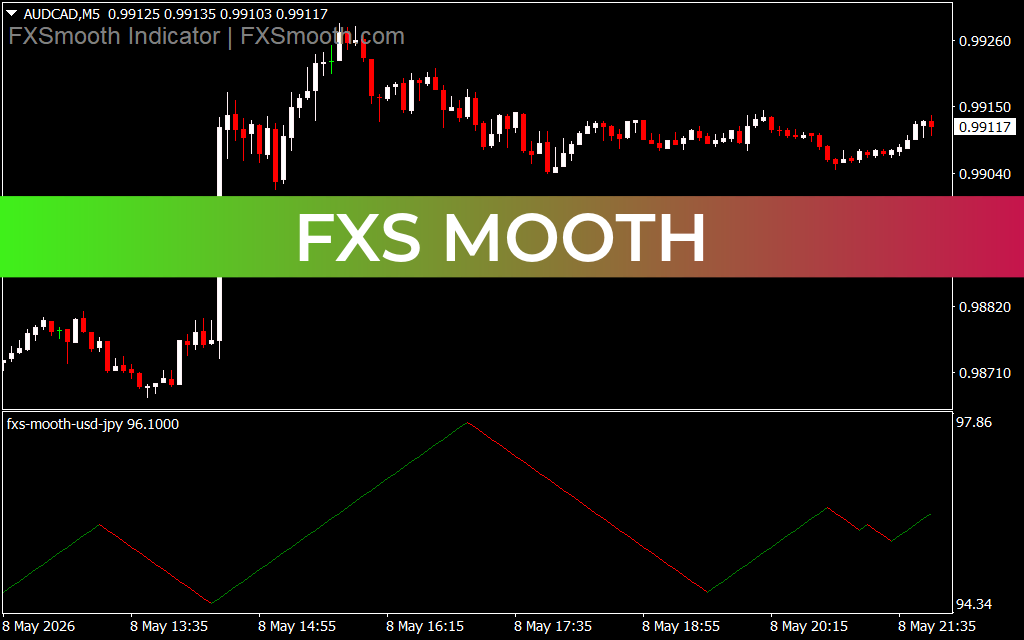
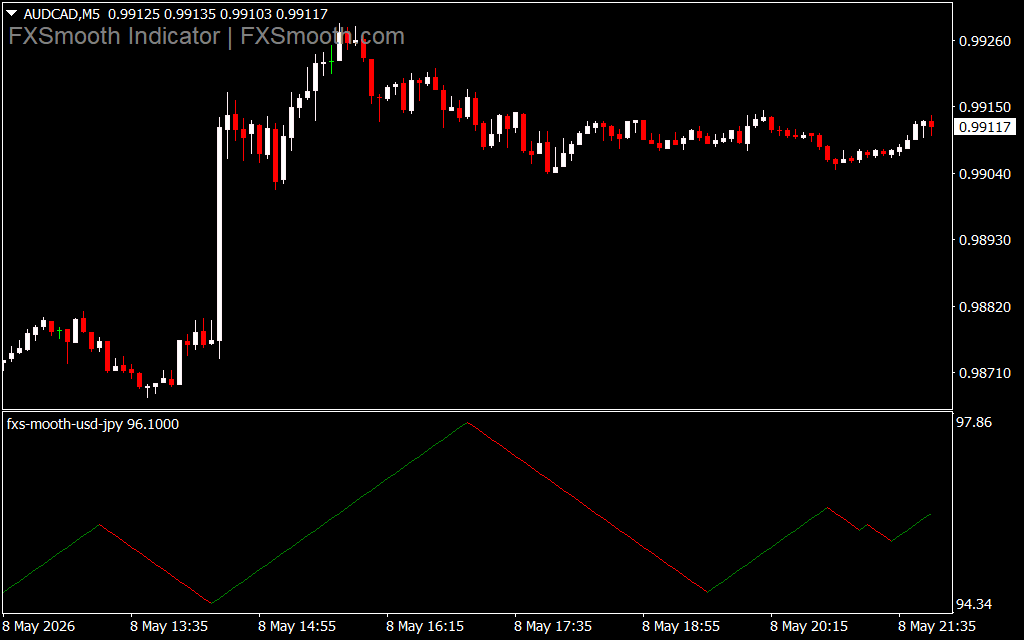
The image displays the FXS Mooth indicator applied to a 5-minute (M5) chart of the AUDCAD pair. This technical tool provides a simplified, geometric visualization of price cycles and momentum shifts, utilizing a clean "zig-zag" style oscillator to highlight trend direction and potential exhaustion points.
Simplify Market Cycles with the FXS Mooth Indicator for MT4/MT5
In a market often cluttered with noise and complex oscillators, the FXS Mooth indicator stands out by offering a minimalist yet powerful approach to trend analysis. Designed for traders who value clarity, this indicator transforms raw price data into a continuous, smoothed geometric path. By focusing on the core "rhythm" of the market, the FXS Mooth helps traders identify high-probability reversal zones and stay aligned with the prevailing momentum.
What is the FXS Mooth Indicator?
The FXS Mooth is a specialized oscillator that plots a series of connected lines—resembling a refined zig-zag or triangular wave—in a separate indicator window. Unlike standard oscillators that can be overly sensitive to minor price fluctuations, the "Mooth" algorithm applies a unique smoothing process to filter out intraday "market breath" and highlight the actual structural moves.
As seen in the AUDCAD chart, the indicator uses a dual-color system to signal market state:
- Green Lines: Indicate a bullish phase or upward momentum buildup.
- Red Lines: Signal a bearish phase or downward pressure.
Strategic Benefits of Geometric Smoothing
- Visualizing Price Harmony: The indicator maps out the market in clear peaks and troughs. This allows traders to visualize the "swing" of the market, making it much easier to spot cycles of expansion and contraction.
- Early Reversal Detection: By observing the slope and color change of the FXS Mooth lines, traders can anticipate potential turning points before they are fully evident in the candlestick patterns.
- Reduced Emotional Trading: Because the indicator provides a "smoothed" view of the trend, it prevents traders from panicking during minor counter-trend pullbacks, helping them hold winning positions for longer.
- Universal Timeframe Compatibility: While shown here on a 5-minute chart for Scalping, the FXS Mooth algorithm is equally effective on H1 or Daily timeframes for swing and position trading.
How to Trade with FXS Mooth
The most common application for the FXS Mooth is as a momentum filter. When the indicator reaches a peak and begins to plot a red line downward, it suggests that the bullish momentum is exhausted, offering a signal to tighten stop-losses or look for "sell" opportunities. Conversely, a trough followed by a green upward line signals a fresh wave of buying pressure.
For maximum accuracy, many professional traders pair the FXS Mooth with Price Action levels. For example, if the indicator hits a trough (turning green) exactly at a known support level, the statistical probability of a successful long trade increases significantly.
Conclusion
The FXS Mooth indicator is an essential tool for the modern technical analyst. It strips away the complexity of the markets and provides a clear, actionable map of price momentum. Whether you are a beginner looking for a simple trend-following tool or an expert needing a clean momentum filter, FXS Mooth provides the precision and clarity required to succeed.
1 Download
Last Update:
May 09, 2026 01:02 AM
Published:
Jan 25, 2026 16:32 PM
Category: