Mastering Lower Timeframe Volatility with GlasNeba Indicator V1
Trading volatile intraday setups on the 1-minute (M1) timeframe requires instant structural clarity and precise execution rules. For high-frequency scalpers and binary options traders, liquid currency pairs like the EUR/USD offer continuous opportunities, but they also bring substantial market noise. Without a reliable technical framework to define trading ranges, retail traders frequently get caught chasing price extensions at structural tops or selling at the absolute floor of a market cycle.
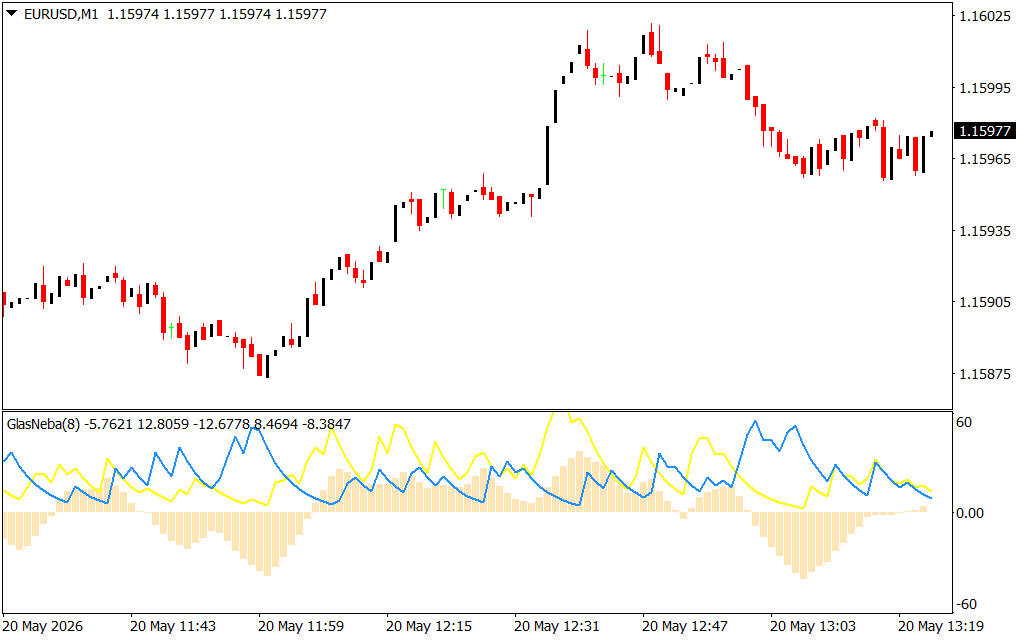
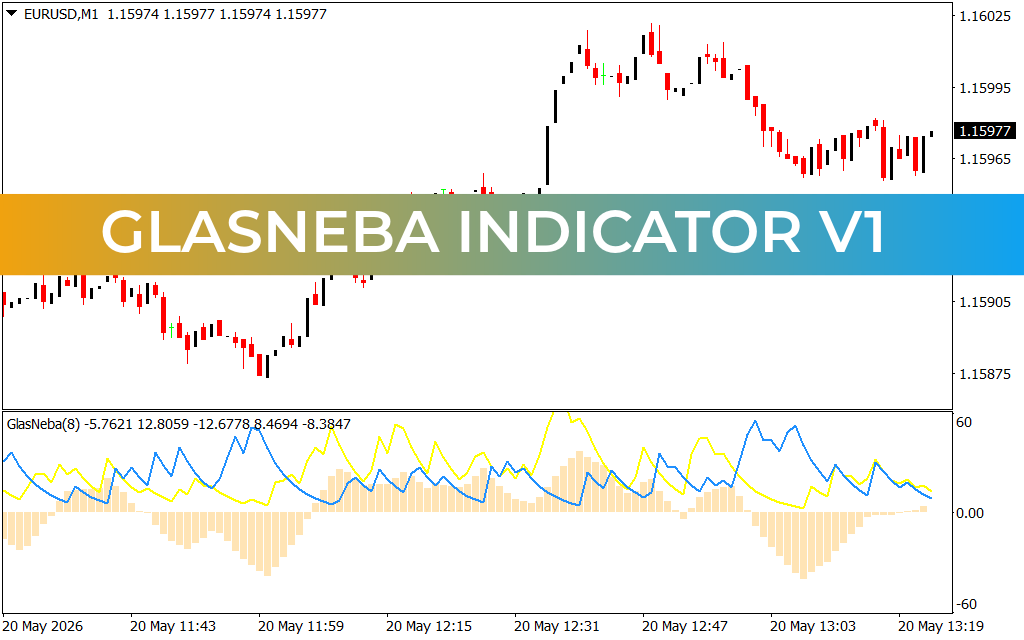
Looking closely at the EUR/USD M1 chart on May 20th, the Price Action highlights a classic intraday accumulation and expansion phase. The asset initially undergoes a choppy markdown sequence, dropping from local distribution levels near 1.15940 to hunt buy-side liquidity at a structural floor of 1.15870. Right after this exhaustive wash-out, a heavy influx of institutional buying volume pours into the market. This triggers an aggressive, vertical expansion that rockets the exchange rate up through multiple local resistance structures to peak past the 1.16010 handle. Capturing these lightning-fast momentum reversals with tight risk parameters is exactly where the GlasNeba Indicator V1 provides a major technical edge.
The Power of Dynamic Overbought and Oversold Banding
The GlasNeba Indicator V1 is an advanced technical analysis tool engineered specifically to smooth out high-frequency noise and frame price delivery inside clear mathematical volatility corridors. Operating as a hybrid price envelope, the algorithm continuously recalculates standard deviation and momentum metrics to project fluid structural Support And Resistance lines directly onto your platform:
- The Lower Demand Boundary: As the EUR/USD plummets toward its 11:50 low, it aggressively tests the lower boundary of the indicator's channel. When price action pierces or exhaustion candles form at this lower band, it signals an extreme oversold condition where seller capacity is fully depleted. This alerts traders to stop shorting and look for immediate, high-probability V-shaped long setups.
- The Upper Supply Ceiling: Conversely, during the rapid vertical markup phase, the aggressive bullish candles stretch up to test the upper volatility band near 1.16010. Reaching this upper perimeter flags a heavily overextended, overbought environment where buying momentum is likely to stall or reverse, providing an objective target to lock in pips or enter quick counter-trend scalps.
Optimizing Your Intraday Workspace for Success
Attempting to guess market turning points based purely on raw candlesticks introduces severe psychological hesitation and costly execution delay. By automating your range boundaries with an adaptive charting channel, you standardize your rules for entry, exit, and stop-loss placement.
The GlasNeba V1 script is fully optimized to run seamlessly in the background without causing chart lag or resource drag on your terminal. The customizable settings panel allows you to modify lookback periods, adjust envelope sensitivity to match shifting volatility regimes, and configure instant push notifications. Integrating this professional filtering software into your MetaTrader setup removes emotional bias, protects your trading capital, and aligns your portfolio with true institutional order flow.
1 Download
Last Update:
May 20, 2026 16:24 PM
Published:
Jan 18, 2026 17:25 PM
Category: