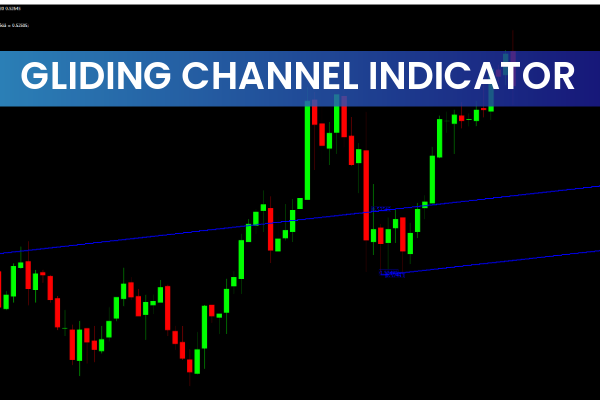
The Gliding Channels Indicator for MT4 automatically scans price charts, identifies channel patterns, and plots them in real time. Instead of manually searching for trend lines, traders can focus on confirming trade setups and managing risk effectively.
This MT4 channel indicator helps traders recognize bullish and bearish channels, making it ideal for trend-following and reversal trading strategies. Whether you’re a beginner or an experienced trader, the Gliding Channels Indicator provides clear visual guidance to help you trade with more confidence.
How the Gliding Channels Indicator Works
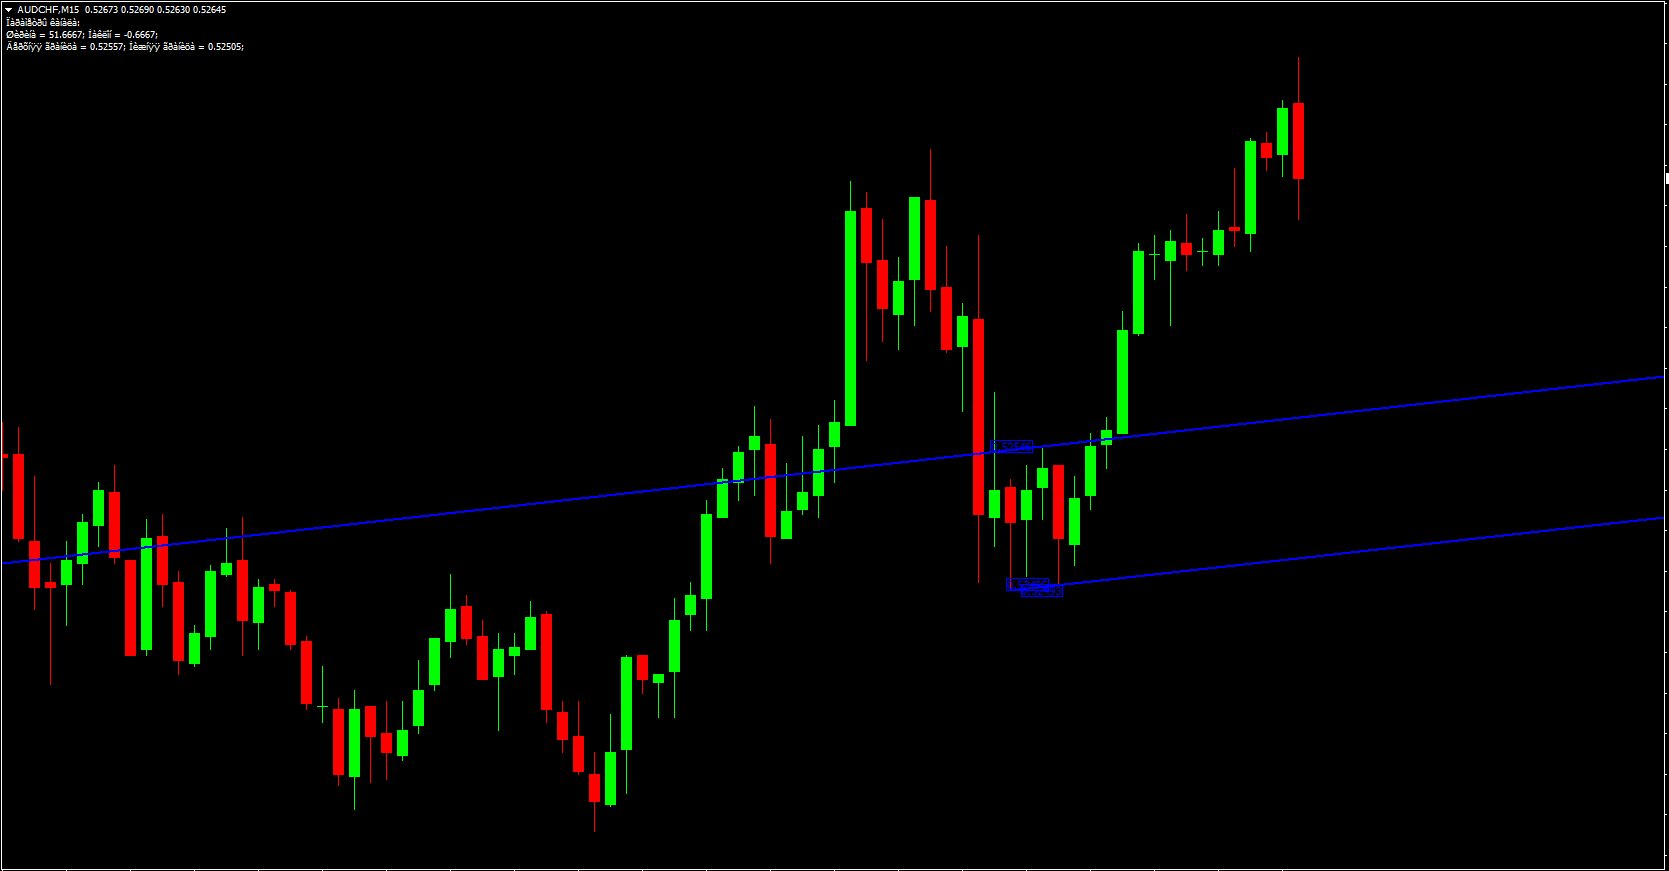
Once installed on your MetaTrader 4 platform, the Gliding Channels Indicator automatically detects price channel formations based on Market Structure. It draws the upper and lower channel lines dynamically, showing potential Support And Resistance levels.
Each channel boundary is labeled with price values, allowing traders to monitor breakouts and reversals in real time. When price approaches the lower boundary, the indicator highlights a potential buy opportunity; when price nears the upper boundary, it signals a possible sell setup.
This functionality makes the Gliding Channels Indicator a valuable companion for intraday and swing trading strategies.
Trading with the Gliding Channels Indicator for MT4
The key to maximizing the indicator’s potential lies in combining it with Price Action analysis or additional confirmation tools like RSI, MACD, or candlestick patterns.
Bullish Channel Trading Setup
When the price reaches the lower channel line and shows signs of a reversal (e.g., bullish engulfing pattern), traders can enter a buy trade.
Entry: After a bullish confirmation near the lower boundary
Stop Loss: Below the channel support
Take Profit: Near the upper channel line
If the price breaks below the lower line, the signal is invalidated, indicating a potential downtrend continuation.
Bearish Channel Trading Setup
Conversely, when price touches the upper channel line and starts reversing downward, a sell trade may be appropriate.
Entry: After a bearish confirmation candle near resistance
Stop Loss: Above the channel
Take Profit: Around the lower channel boundary
Because pullbacks often occur near these zones, traders should verify signals using trend confirmation tools or volume analysis to reduce false entries.
Why Use the Gliding Channels Indicator
Here are some key reasons traders prefer the Gliding Channels Indicator for MT4:
Automatic Detection: Saves time by scanning and plotting channels automatically.
Visual Clarity: Clearly displays Trend Continuation or reversal zones.
Adaptability: Works effectively across all timeframes – from M5 to D1.
Ease of Use: Suitable for beginners who may struggle with manual trendline drawing.
Accuracy: Provides high-quality channel formations that adjust dynamically with price action.
Whether you trade forex, indices, or commodities, the Gliding Channels Indicator enhances your technical analysis and helps improve decision-making.
Best Practices for Using Gliding Channels
To achieve the best results:
Combine the indicator with trend confirmation tools such as Moving Averages or MACD.
Avoid entering trades immediately after a breakout; wait for a retest of the broken line.
Backtest your strategy on multiple pairs and timeframes.
Always maintain risk management—never risk more than 1–2% per trade.
For traders seeking to elevate their technical skills, understanding price action within channels can significantly enhance accuracy.
Conclusion
In summary, the Gliding Channels Indicator for MT4 is an excellent tool for traders who want to automate the process of detecting channel chart patterns. By visually plotting bullish and bearish channels, it simplifies technical analysis and helps identify potential trade setups quickly.
If you’re looking to trade more efficiently and confidently, download the Gliding Channels Indicator from IndicatorForest.com today and experience smarter charting automation.
5 Downloads
Published:
Nov 01, 2025 15:05 PM
Category: