Navigating Institutional Liquidity with the Gold Level Indicator
In the financial markets, price does not move at random. Trends expand, stall, and reverse at highly specific areas where institutional Supply And Demand sit waiting to be filled. For traders focusing on major macro assets like gold, indices, or major Forex pairs, identifying these heavy liquidity zones before price reaches them is the ultimate edge. While retail software often relies on lagging mathematical bands, professional technical frameworks map the market using raw price levels. The Gold Level indicator brings this institutional perspective straight to your MetaTrader chart layout.
What is the Gold Level Indicator?
The Gold Level indicator is a predictive Support And Resistance tool engineered to calculate and display structural market levels automatically. Instead of traditional trailing indicators that tell you what happened in the past, this tool focuses exclusively on future key execution checkpoints.
By analyzing macro volume distributions, historic pivot points, and mathematical market geometric extensions, the indicator identifies major institutional price clusters. It functions perfectly across any charting frequency—from rapid intraday scaling configurations to long-term macro trend reviews—allowing traders to build a consistent, rule-based approach to the markets.
Interpreting the Macro Price Grid
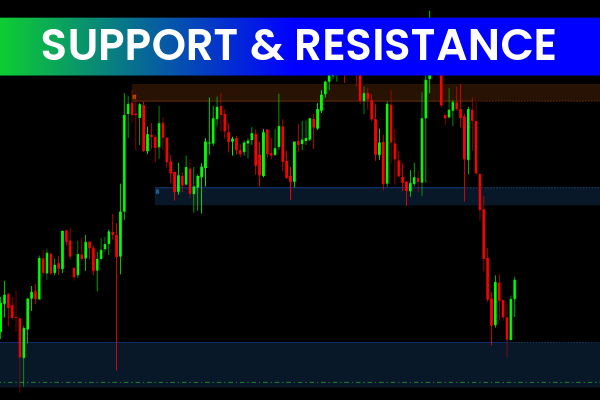
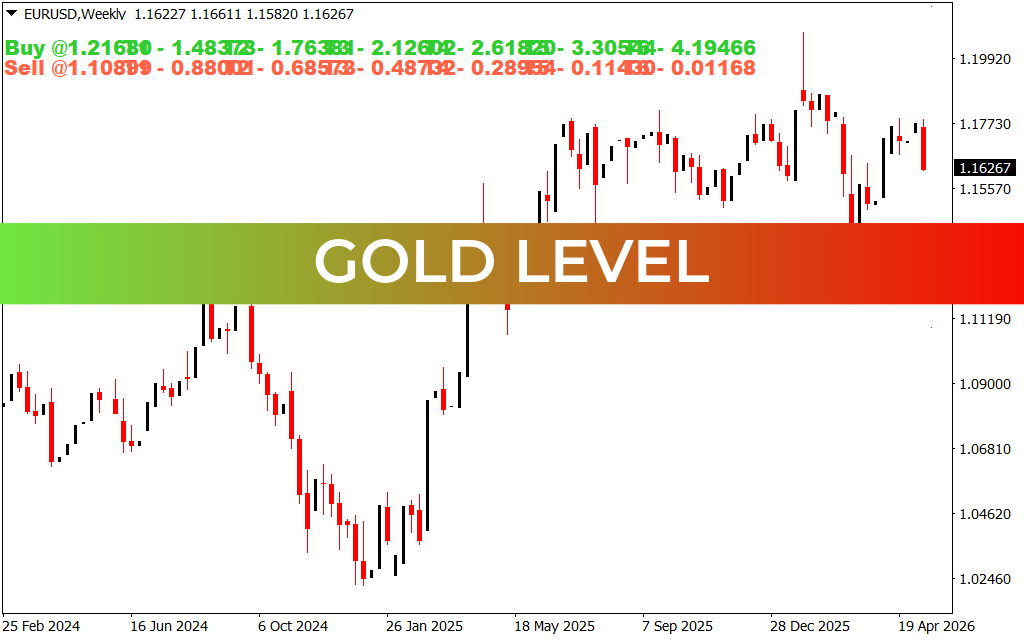
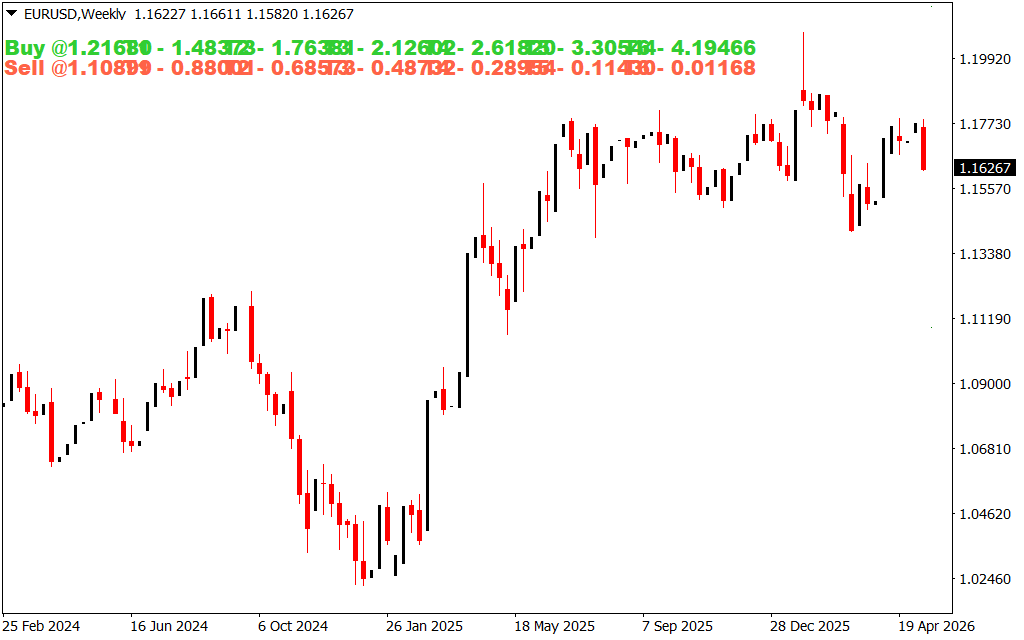
As illustrated on the weekly (Weekly) macro chart for the EUR/USD pair, the Gold Level indicator provides clean, text-based data overlays across the top of your primary price window, organizing raw data into explicit execution bands:
- Institutional Supply Targets (Red Sell Levels): The indicator calculates highly accurate overhead resistance boundaries where large banks and algorithms are mathematically favored to distribute positions. When price climbs into these upper levels, it signals an overextended market state where buying carries massive risk and short-selling momentum is building.
- Institutional Demand Targets (Green Buy Levels): Conversely, the system projects deep structural support baselines along the bottom. These areas highlight prime accumulation zones. When a macro downtrend flattens into these coordinates, it signals that the sell-off is exhausting, opening a clean window for strategic buyers.
By laying out the exact math on the screen, this indicator completely removes the subjective guesswork of drawing support and resistance lines manually.
Advanced Strategic Execution
To unlock the maximum statistical probability from the Gold Level indicator, combine its predictive targets with strict Price Action confirmations:
- Macro Target Magnetism: When a major breakout occurs, price will naturally gravitate toward the next major projected indicator level. Traders can use these levels as highly objective take-profit targets for their running trend-continuation setups.
- Structural Rejections: Do not simply place blind limit orders at the levels. Instead, wait for price to enter a projected buy or sell zone on your weekly or daily chart. Once price tests the level, drop down to an intraday execution frame (like the H1 or M15) and watch for a clean structural shift to time your entry perfectly.
By framing price action within institutional supply and demand realities, the Gold Level indicator strips away analysis paralysis and helps you trade with institutional precision.
3 Downloads
Last Update:
May 21, 2026 02:41 AM
Published:
Jan 18, 2026 13:47 PM
Category: