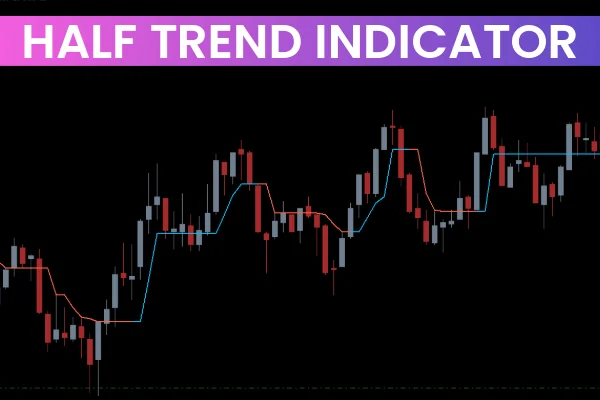
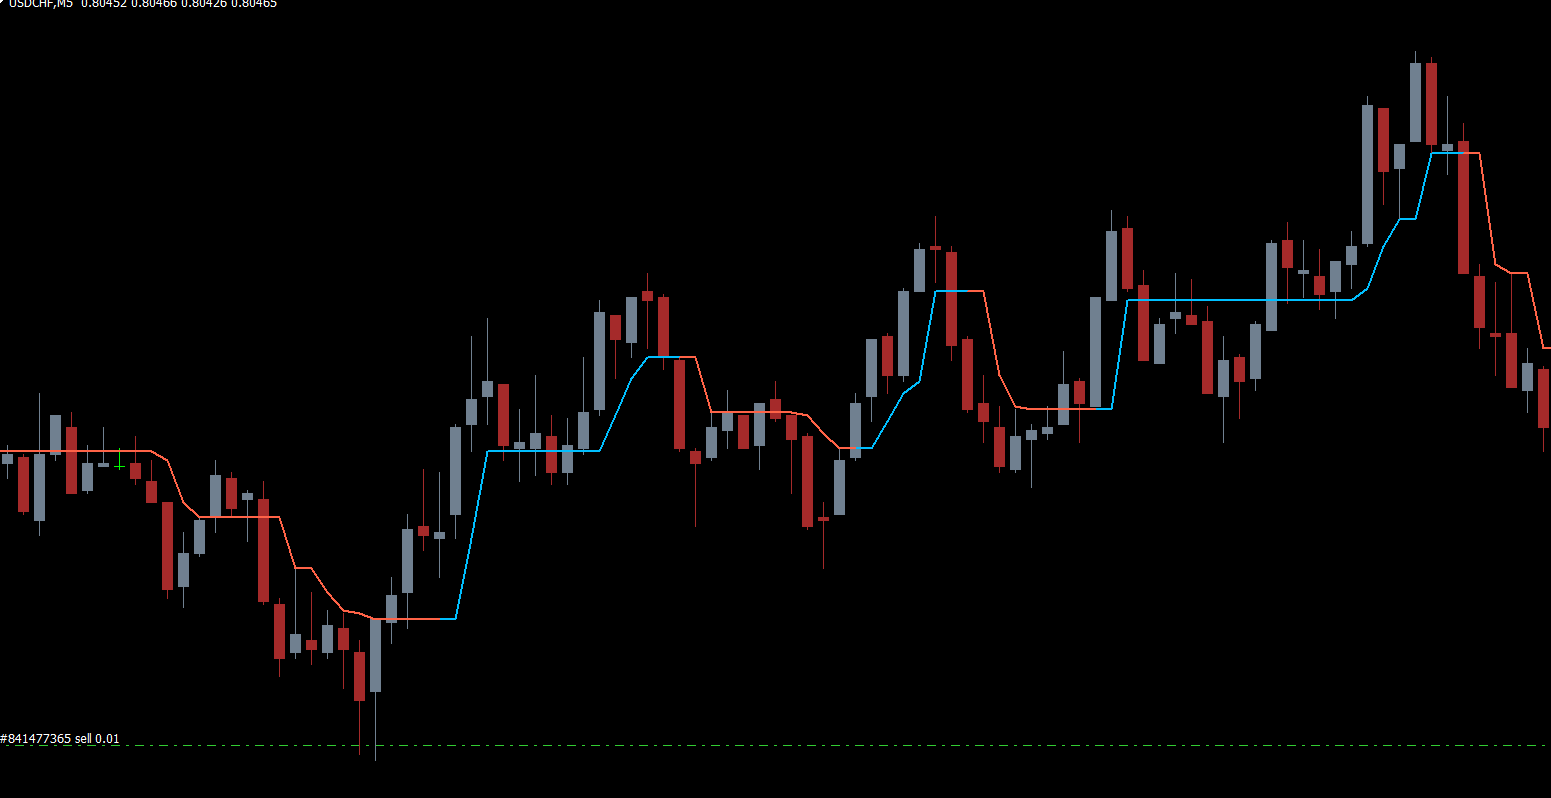
The Half Trend Indicator for MT4 is a versatile trend-following tool designed to help traders identify the prevailing market direction and potential reversals. By plotting a dynamic signal line on your chart, this indicator visually shows trend shifts, making it ideal for scalpers, day traders, and swing traders alike. The signal line changes color based on the trend—blue for an uptrend and red for a downtrend—allowing traders to make informed decisions quickly.
Unlike other indicators that lag behind price movements, the Half Trend Indicator follows Price Action closely, providing timely signals. Its simplicity makes it suitable for traders of all experience levels, while its adaptability allows it to work across multiple timeframes.
How the Half Trend Indicator Works
The Half Trend Indicator MT4 tracks price movements and plots a single signal line on your chart. This line serves as a visual representation of the current market trend. The indicator operates on the principle of trend-following and uses advanced algorithms to detect trend reversals early.
Blue Line: Suggests bullish conditions and signals a potential long entry.
Red Line: Indicates bearish conditions and signals a potential short entry.
While it can be applied to all timeframes, traders often find longer timeframes like H4 or Daily more reliable to reduce false signals. Shorter timeframes can be more volatile and may generate more noise.
How to Trade With the Half Trend Indicator
Trading with the Half Trend Indicator is straightforward, thanks to its color-coded signal line.
Entering Trades
Long Positions: When the signal line turns blue, it indicates the market is trending upward. Traders may enter a buy trade at the next candle open.
Short Positions: When the signal line turns red, it signals a downtrend. Traders can consider selling at the next candle open.
Exiting Trades
The Half Trend Indicator also provides exit cues. A change in line color can act as a signal to close your existing positions. For example, if you are in a long trade and the line switches from blue to red, it may be time to exit and protect profits.
Confirming Signals
For improved accuracy, combine the Half Trend Indicator with other technical tools such as:
RSI (Relative Strength Index) – Confirms overbought/oversold conditions.
MACD (Moving Average Convergence Divergence) – Validates momentum and Trend Strength.
Support And Resistance Levels – Adds precision to entries and exits.
This synergy ensures that trades align with both trend direction and market momentum.
Benefits of Using the Half Trend Indicator
Simple Visual Signals: Color-coded line makes trend identification easy.
Trend Reversal Detection: Helps identify market turning points effectively.
Flexible Across Timeframes: Works on M15, H1, H4, and Daily charts.
Free to Use: Available for download at IndicatorForest.com.
Compatible With Other Tools: Enhances traditional strategies with confirmation signals.
Conclusion
The Half Trend Indicator for MT4 is an essential tool for traders seeking clear trend-following signals and early reversal detection. Its dynamic signal line and color-coded alerts simplify decision-making and reduce guesswork. By combining it with other technical indicators such as RSI or MACD, traders can further enhance the accuracy of their trading strategies.
Whether you are a novice or an experienced trader, the Half Trend Indicator provides actionable insights to enter and exit trades confidently. Download it for free from IndicatorForest.com and start improving your trading performance today.
FAQ
2 Downloads
Published:
Dec 07, 2025 02:04 AM
Category: