Pinpoint Market Exhaustion with the Heiken Ashi Doji Spotter Indicator
In the fast-moving Forex market, recognizing exactly when a strong trend is losing momentum is one of the most profitable skills a trader can develop. Traditional candlestick patterns can be noisy, frequently printing minor pullbacks that look like full reversals, leading to premature exits or costly false entries. For technical traders monitoring highly liquid pairs like the EUR/USD on intraday intervals such as the 30-minute (M30) chart, visual clarity is paramount. The Heiken Ashi Doji Spotter indicator provides a specialized solution by merging smooth price tracking with precise candlestick pattern recognition.
What is the Heiken Ashi Doji Spotter Indicator?
The Heiken Ashi Doji Spotter is a custom visual charting tool built for trading platforms like MetaTrader. It is engineered to identify institutional exhaustion zones by tracking specific candlestick behavior within a modified pricing framework.
Rather than calculating raw open, high, low, and close prices, the indicator utilizes Heiken Ashi mathematical smoothing to filter out erratic market noise and highlight clear directional trends. It then monitors these smoothed candles for the formation of a Doji—a candlestick where the opening and closing prices are virtually identical. A Doji signifies a state of complete market equilibrium, indicating that the prevailing buying or selling pressure has completely exhausted itself.
Key Visual Features and Trading Insights
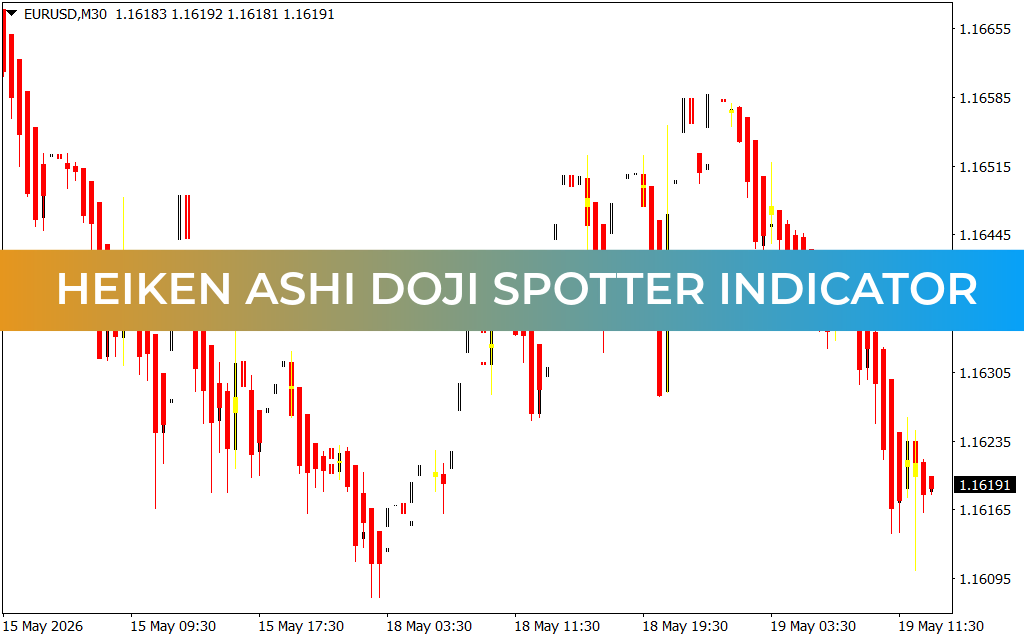
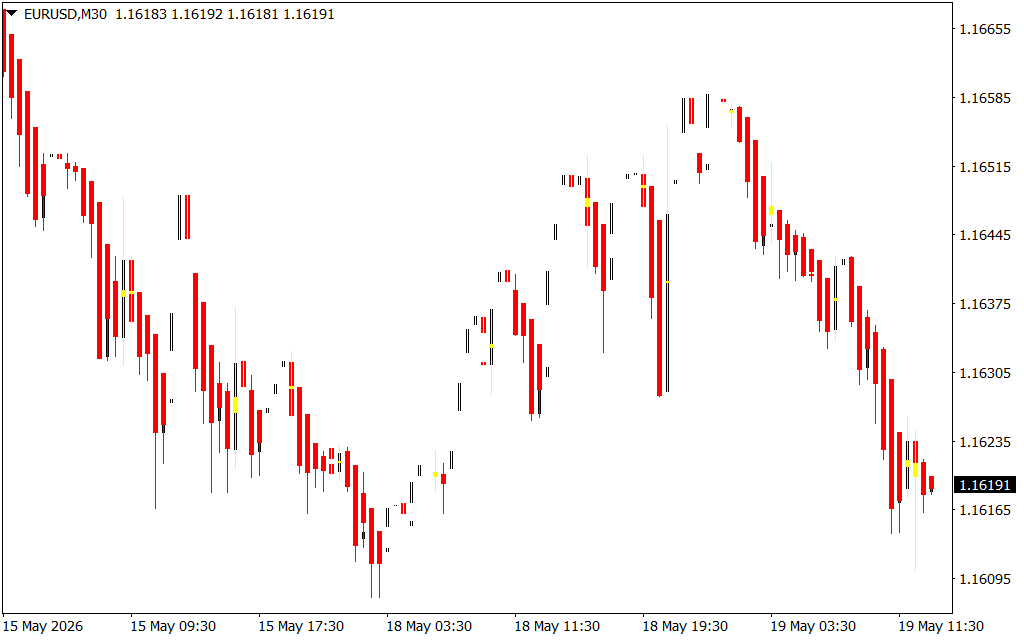
- Targeted Highlight Overlays: Instead of forcing you to hunt for individual small candles, the indicator automatically highlights key structural Dojis directly on your main interface using distinct color variations (such as yellow and black candle fills).
- Smoothed Price Action: By changing the standard red and white bar sequence into clear, continuous trends, it allows you to stay in winning trades longer without panicking during minor retracements.
- Early Exhaustion Warnings: As displayed on the EUR/USD M30 chart, these highlighted candles consistently appear at macro swing highs and swing lows, acting as an early warning system before a sharp Trend Reversal begins.
- Clean Layout Integration: The indicator replaces or overlays standard candlesticks, ensuring your primary chart remains clean, uncluttered, and ready to pair with external support, resistance, or volume filters.
How to Trade with Heiken Ashi Doji Spotter
To maximize the accuracy of the Heiken Ashi Doji Spotter, it should be used to spot trend reversals at established market structural levels.
- Shorting Swing Highs: When an asset is in a prolonged uptrend and approaches a major historical resistance ceiling, watch for the indicator to spotlight a yellow or black Doji candle. This confirms that buyers have lost control. Place a sell order at the close of the candle, with a stop-loss positioned safely above the swing high.
- Buying Swing Lows: Conversely, when price action slides down to a verified demand zone and a highlighted Doji candle prints, it proves selling exhaustion. Execute a buy position as the next candle builds upward momentum to capture the new bullish reversal leg.
Optimize your entry precision and stop guessing where trends will end by downloading the Heiken Ashi Doji Spotter indicator today.
1 Download
Last Update:
May 19, 2026 16:32 PM
Published:
Jan 19, 2026 13:45 PM
Category: