Automate High-Probability Setups with the Harmonic Pattern Finder
In technical analysis, geometric price structures represent some of the most reliable multi-confluence setups available to retail traders. Built upon precise Fibonacci ratio relationships, patterns such as the Gartley, Bat, Butterfly, and Crab allow market analysts to pinpoint institutional reversal zones with immense structural accuracy. However, manually scanning multiple charts to identify these intricate geometric structures across several timeframes can lead to extreme mental exhaustion and missed entries.
The Harmonic Pattern Finder is a premium technical charting utility built to fully automate pattern scanning. By processing historical and live price streams simultaneously, it plots institutional turning points directly onto your platform workspace.
Algorithmic Pattern Mapping and Visual Tracking
Whether Scalping fast intraday intervals or evaluating swing setups, visual clarity is paramount to preventing execution errors. The Harmonic Pattern Finder operates via a high-performance calculation engine that eliminates manual trendline plotting.
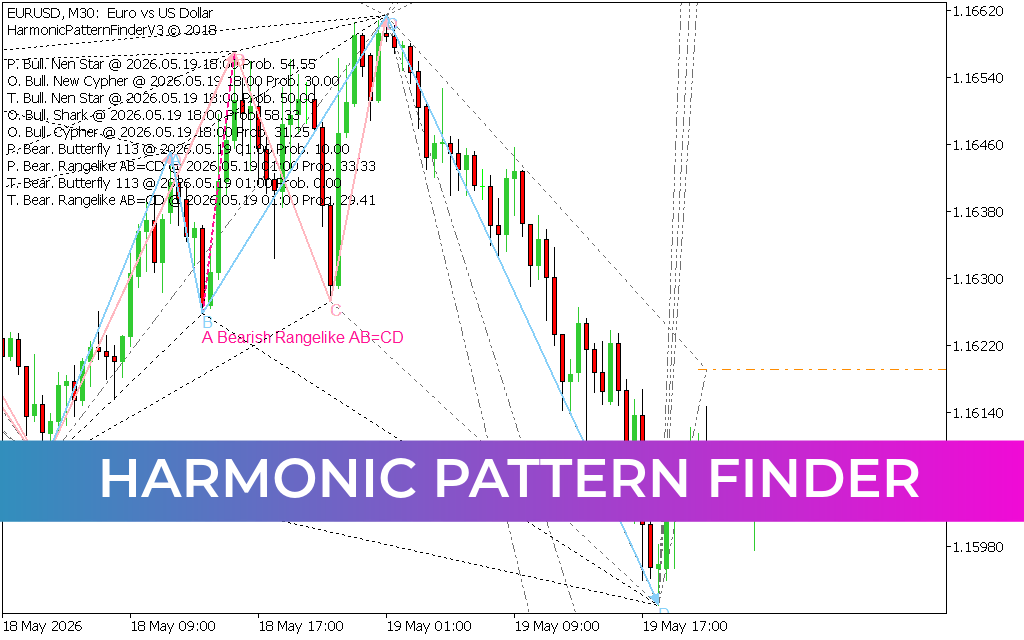
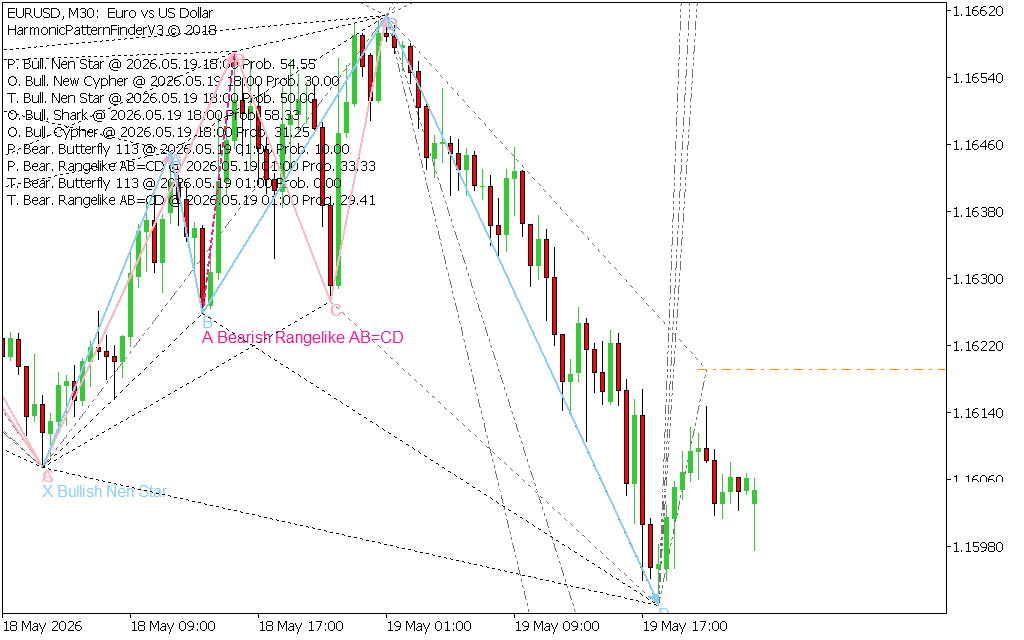
As demonstrated on the 30-minute ($M30$) EUR/USD terminal workspace running advanced script versions like HarmonicPatternFinderV3, the software delivers a highly interactive visual architecture:
- Automated Geometric Vector Tracking: The script automatically connects swing pivots with color-coded trend vectors. It highlights complex mathematical formations such as a Bullish Nen Star or a Bearish Rangelike AB=CD leg, allowing traders to see evolving market geometry instantly.
- Live Probability and Pattern Diagnostics: Rather than leaving you to guess the validity of a pattern, the indicator displays a real-time data overlay directly in the upper-left corner. This dashboard details active structures, exact pivot timestamps, and pattern probabilities (e.g.,
Prob. 54.55), ensuring you only trade high-statistical-edge setups. - Target Mapping Zones: Once a pattern completes its final "D" pivot leg, the indicator projects precise structural projection lines across the canvas, highlighting optimal entry zones and logical targets.
Developing a Mechanical Execution Strategy
Integrating the systemic automated scans of the Harmonic Pattern Finder into your daily operation provides a highly structured approach to market reversals.
1. Capitalizing on Harmonic Reversals
The true edge of harmonic trading lies in catching the exact pivot point where a pattern completes. For example, when the indicator tracks price into a fully formed X Bullish Nen Star zone near a major structural low, it signals that multiple Fibonacci retracement vectors have converged. When Price Action stalls and respects this calculated terminal zone, it provides an objective, low-risk entry to ride the ensuing upward expansion.
2. Filtering Counter-Trend Volatility
Financial markets consistently form smaller harmonic legs inside larger macro trends. By combining the indicator's real-time probability dashboard with higher-timeframe support or resistance levels, day traders can easily filter out low-probability formations that run counter to dominant institutional volume, protecting trading capital from erratic market traps.
Conclusion
The Harmonic Pattern Finder is an essential workstation utility for technical analysts who demand rule-based precision without the stress of manual calculation. By instantly identifying complex geometric structures and delivering real-time probability diagnostics, it streamlines your daily workflow. Download the Harmonic Pattern Finder today to optimize your platform and trade structural reversals with complete confidence.
7 Downloads
Last Update:
May 20, 2026 02:18 AM
Published:
Jan 19, 2026 01:00 AM
Category: