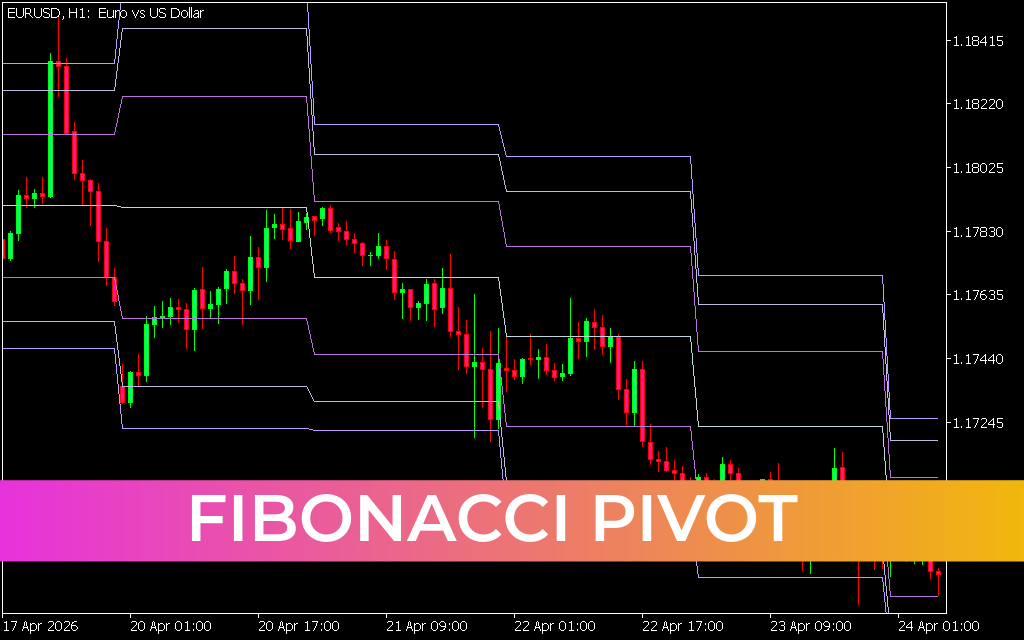
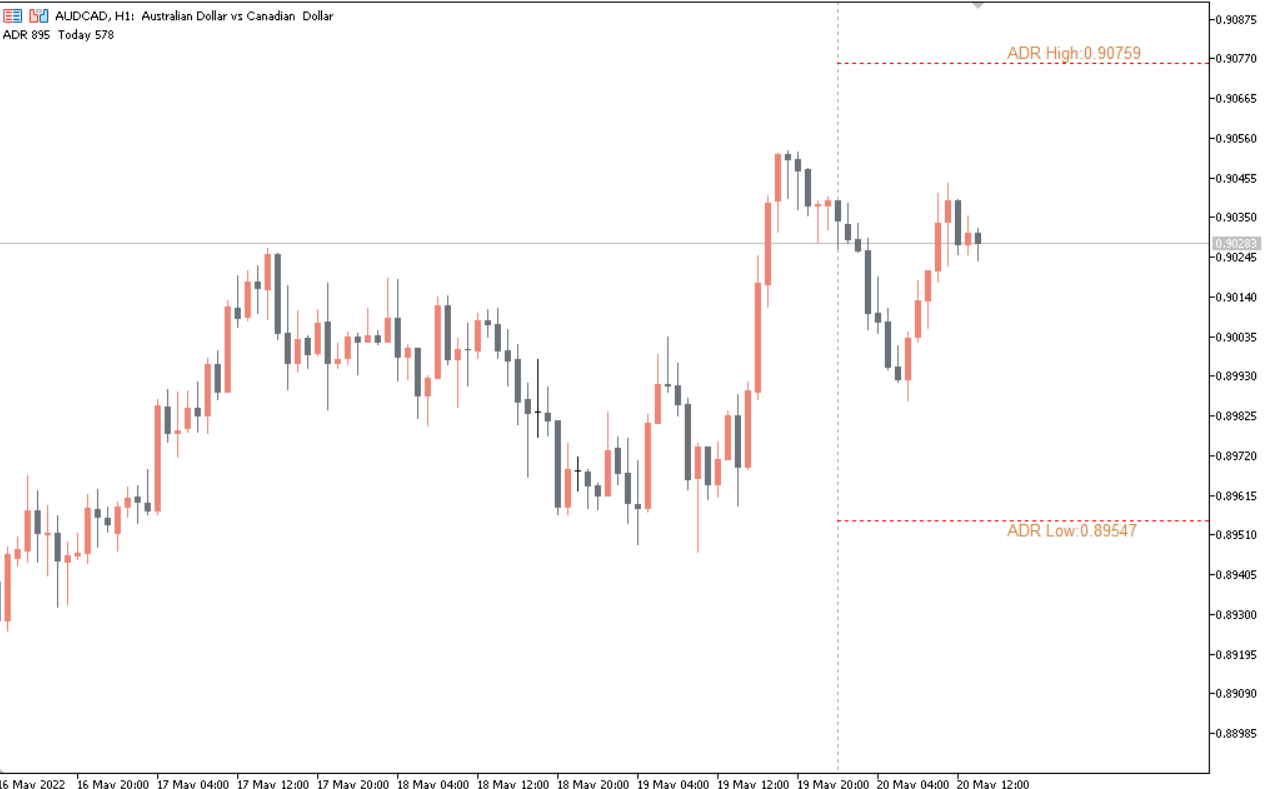
The ADR Indicator for MT5 calculates the Average Daily Range to show how far a currency pair typically moves in a day. This tool displays the ADR range, the current day’s range, and projected upper and lower price limits. Because the focus keyword is based on volatility measurement, it helps traders understand the expected daily market movement, identify potential reversals, and detect breakout opportunities.
How the ADR Indicator Works
The ADR indicator relies on the ATR (Average True Range) values to determine daily volatility. Adjusting the ATR period in the settings directly affects how the ADR values appear on charts:
A lower ATR period produces smaller ADR values because it uses less historical data.
A higher ATR period results in larger and smoother ADR readings based on wider data.
Since each forex pair has unique volatility characteristics, traders must experiment with different ATR values to match their trading strategy and market conditions.
Why Traders Use the ADR Indicator for MT5
The ADR Indicator is suitable for beginners and experienced traders alike.
Beginners can:
View ADR levels as Support And Resistance
Observe how price reacts at daily highs and lows
Use ADR to avoid trading in overextended market zones
Experienced traders can:
Combine ADR with other technical indicators
Use it for volatility-based trading systems
Filter high-probability setups during specific sessions
Trading with the ADR Indicator for MT5
Reversal Trading Strategy
Since ADR highlights the expected daily high and low, these zones often act as intraday turning points.
Buy Setup:
Price touches the lower ADR line
Look for bullish reversal patterns
Place stop loss below the previous swing low
Target the upper ADR range
Sell Setup:
Price reaches the upper ADR line
Watch for bearish rejection signals
Stop loss above the swing high
Aim for the lower ADR level
Breakout Trading Strategy
When momentum and volume increase near ADR boundaries, a breakout may occur.
Key signs of a potential breakout:
Strong volume spike
Wide candlestick bodies
Momentum indicators confirming trend continuation
Price failing to reverse despite multiple tests of the ADR boundary
Traders can enter breakout trades with targets based on ATR multiples or intraday support/resistance.
Using ADR Levels on Intraday Timeframes
ADR works effectively on intraday charts such as M15, M30, and H1. These levels often behave as important volatility zones, guiding traders on whether the market is likely to continue or reverse:
At the ADR High: Market is overextended; look for reversal or breakout signals.
At the ADR Low: Price may rebound upward unless strong bearish momentum continues.
Price Action around these zones offers the best insights into reversals or trend continuation patterns.
Installing the ADR Indicator for MT5
The indicator is free, lightweight, and easy to install:
Download the indicator file
Open MT5 → File → Open Data Folder
Insert the file into the Indicators folder
Refresh or restart MT5
Attach the indicator to your chart
After installation, customize ATR settings, colors, and display style according to your trading preferences.
Conclusion
The ADR Indicator for MT5 gives traders a clear understanding of daily price expectations, helping them avoid false breakouts, improve timing, and optimize entries. When combined with price action, support and resistance, and volume indicators, ADR becomes a powerful tool for intraday and swing traders.
For more MT5 and MT4 indicators, tools, and guides, visit IndicatorForest.com.
FAQ
11 Downloads
Published:
Nov 30, 2025 01:26 AM
Category: