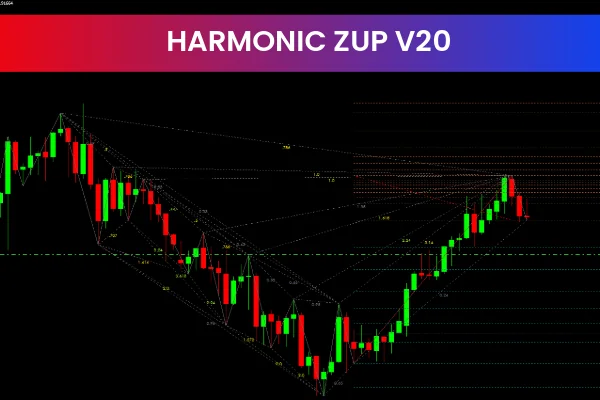
The ZUP Harmonic Indicator is one of the most advanced tools available for identifying harmonic patterns with precision. Harmonic trading relies heavily on Fibonacci ratios and geometric formations to predict trend reversals and continuation points. Using the ZUP Harmonic Indicator allows you to spot these high-probability trading setups quickly—something nearly impossible with the naked eye. This tool helps traders detect key buy and sell zones, improve trade timing, and strengthen overall strategy.
Understanding Harmonic Patterns in Trading
Harmonic patterns are geometric formations built from specific Fibonacci ratios. Traders use them to forecast potential price reversals and continuation levels. While these patterns offer some of the most accurate signals in technical analysis, manually identifying them requires sharp precision and extensive experience.
Why Harmonic Patterns Matter
Harmonic patterns such as Gartley, Bat, Butterfly, and Crab formations help traders anticipate future price movement by measuring price waves. By using Fibonacci extensions and retracements, these patterns reveal areas of interest—often before other traders notice them.
What Makes the ZUP Harmonic Indicator Unique?
Unlike generic indicators, the ZUP Harmonic Indicator automatically detects and draws patterns with correct Fibonacci measurements. This automation eliminates human error and speeds up analysis significantly.
Automated Pattern Detection
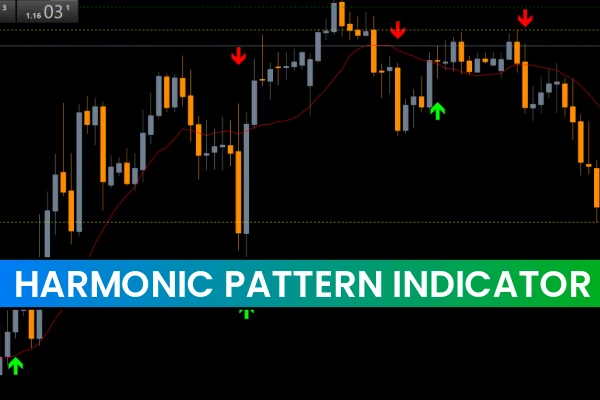
Manually identifying harmonic structures is a tedious and error-prone process. The ZUP Harmonic Indicator scans the chart in real-time, recognizing:
Bat Patterns
Butterfly Patterns
Crab Patterns
ABCD Patterns
Gartley Patterns
Shark Patterns and more
Once detected, the indicator labels the pattern clearly on the chart and highlights its structure for fast visual recognition.
Built-In Stop Loss and Take Profit Levels
One of the standout features of the ZUP Harmonic Indicator is automatic SL and TP placement. The indicator uses Fibonacci logic to determine optimal reversal zones and projected target points. This helps traders confidently manage risk and plan exits without manual calculation.
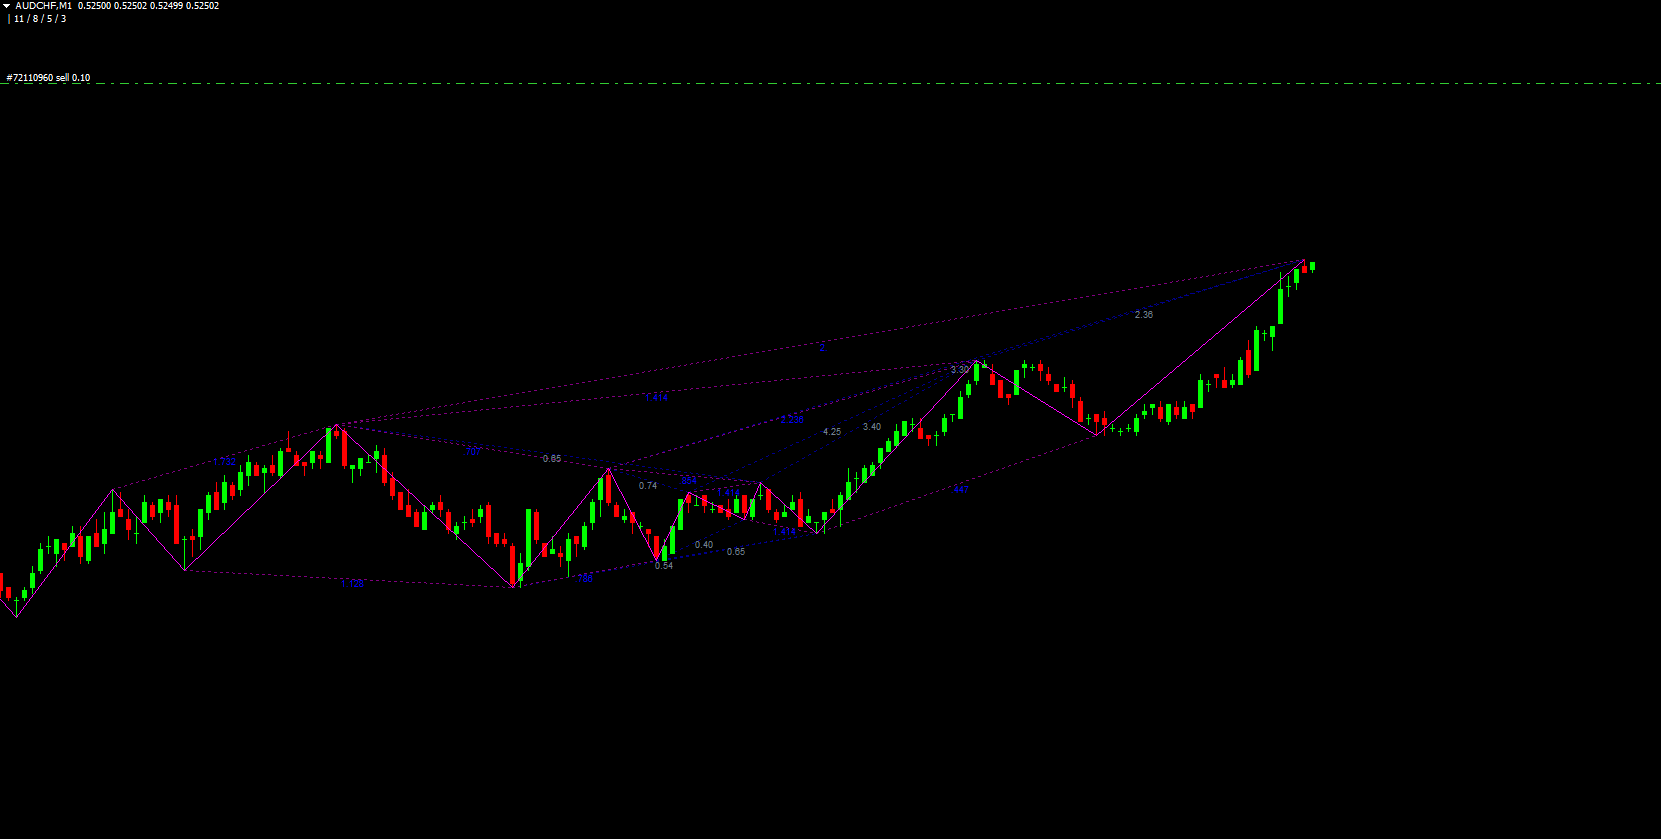
Practical Example Using the ZUP Harmonic Indicator
Consider a 4-hour EUR/USD chart. When the indicator identifies a Shark Pattern, it highlights it visually—often with blue shading or borders. Once the pattern fully develops, traders can wait for confirmation and enter trades at precise reversal zones.
In the example scenario, after the Shark Pattern formed completely, the market moved over 300 pips, confirming the indicator’s accuracy. Even while the pattern is still forming, traders can take advantage of smaller moves, as harmonic patterns rely on exact Fibonacci levels to determine tradable zones.
Benefits for Short-Term and Long-Term Traders
The ZUP Harmonic Indicator adapts well to all trading styles:
Day traders can use it to catch small reversal swings.
Swing traders benefit from clear multi-layer Fibonacci confluence areas.
Long-term traders gain clarity on macro-level turning points.
Because harmonic patterns don’t appear frequently, accuracy is essential. The indicator ensures each pattern is drawn precisely, increasing your odds of catching profitable moves at the right time.
Final Thoughts
Harmonic patterns are among the most profitable tools in forex and crypto trading, but drawing them manually can be difficult and time-consuming. The ZUP Harmonic Indicator removes this complexity by detecting and labeling patterns instantly. Traders can focus on timing and execution instead of calculations.
For more advanced tools, resources, and indicators, visit IndicatorForest.com and elevate your trading strategy today.
FAQ
The Harmonic Pattern Indicator automatically identifies harmonic chart patterns such as Gartley, Butterfly, Bat, Crab, and Cypher patterns. These patterns are based on Fibonacci retracement levels and help traders identify potential reversal zones where price is likely to change direction, making them valuable for timing entries and exits.
The indicator plots potential harmonic patterns on the chart and marks completion zones where traders should watch for reversals. When a pattern completes at a key Fibonacci level (typically 61.8% or 78.6% retracement), it signals a potential reversal point. Bullish patterns suggest buy opportunities, while bearish patterns suggest sell opportunities.
Harmonic patterns are based on mathematical relationships and Fibonacci ratios, making them more objective than subjective chart patterns. The indicator automatically identifies these patterns, eliminating manual pattern recognition errors. Patterns that complete at multiple Fibonacci levels provide stronger signals, and the indicator helps traders identify these high-probability setups.
Wait for pattern completion at key Fibonacci levels, confirm with price action (reversal candles, support/resistance), enter trades in the direction of the expected reversal, place stop-loss beyond the pattern completion point, and set take-profit at the next Fibonacci level or pattern target. Always combine pattern recognition with other technical analysis tools for confirmation.
The indicator automatically identifies complex harmonic patterns saving time and reducing errors, provides objective entry and exit points based on Fibonacci ratios, works on all timeframes and currency pairs, helps identify high-probability reversal zones, and is suitable for both beginners and advanced traders who want to incorporate harmonic pattern analysis into their trading strategy.
4 Downloads
Published:
Dec 13, 2025 00:53 AM
Category: