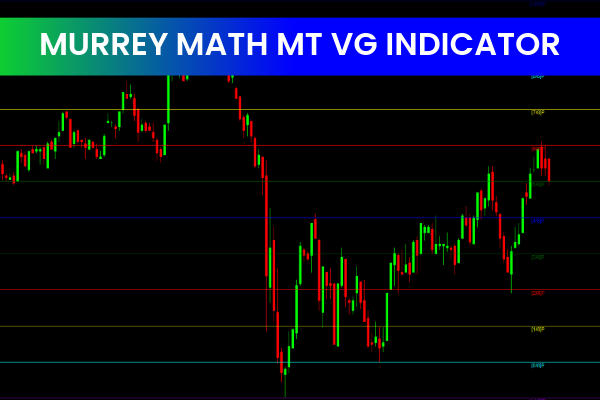
The Murrey Math MT VG indicator for MT4 performs automatic mathematical calculations to identify critical Support And Resistance levels on your chart. By plotting structured Murrey Math lines—such as central pivot reversal levels, overshoot zones, overbought and oversold regions, and stall or reversal points—this indicator gives forex traders a clear visual framework for understanding Market Structure.
Because the Murrey Math MT VG indicator maps upper and lower price boundaries, traders can confirm optimal Buy and Sell entry and exit points using Price Action, making it a powerful addition to any MT4 technical analysis setup.
Key Features and Line Types
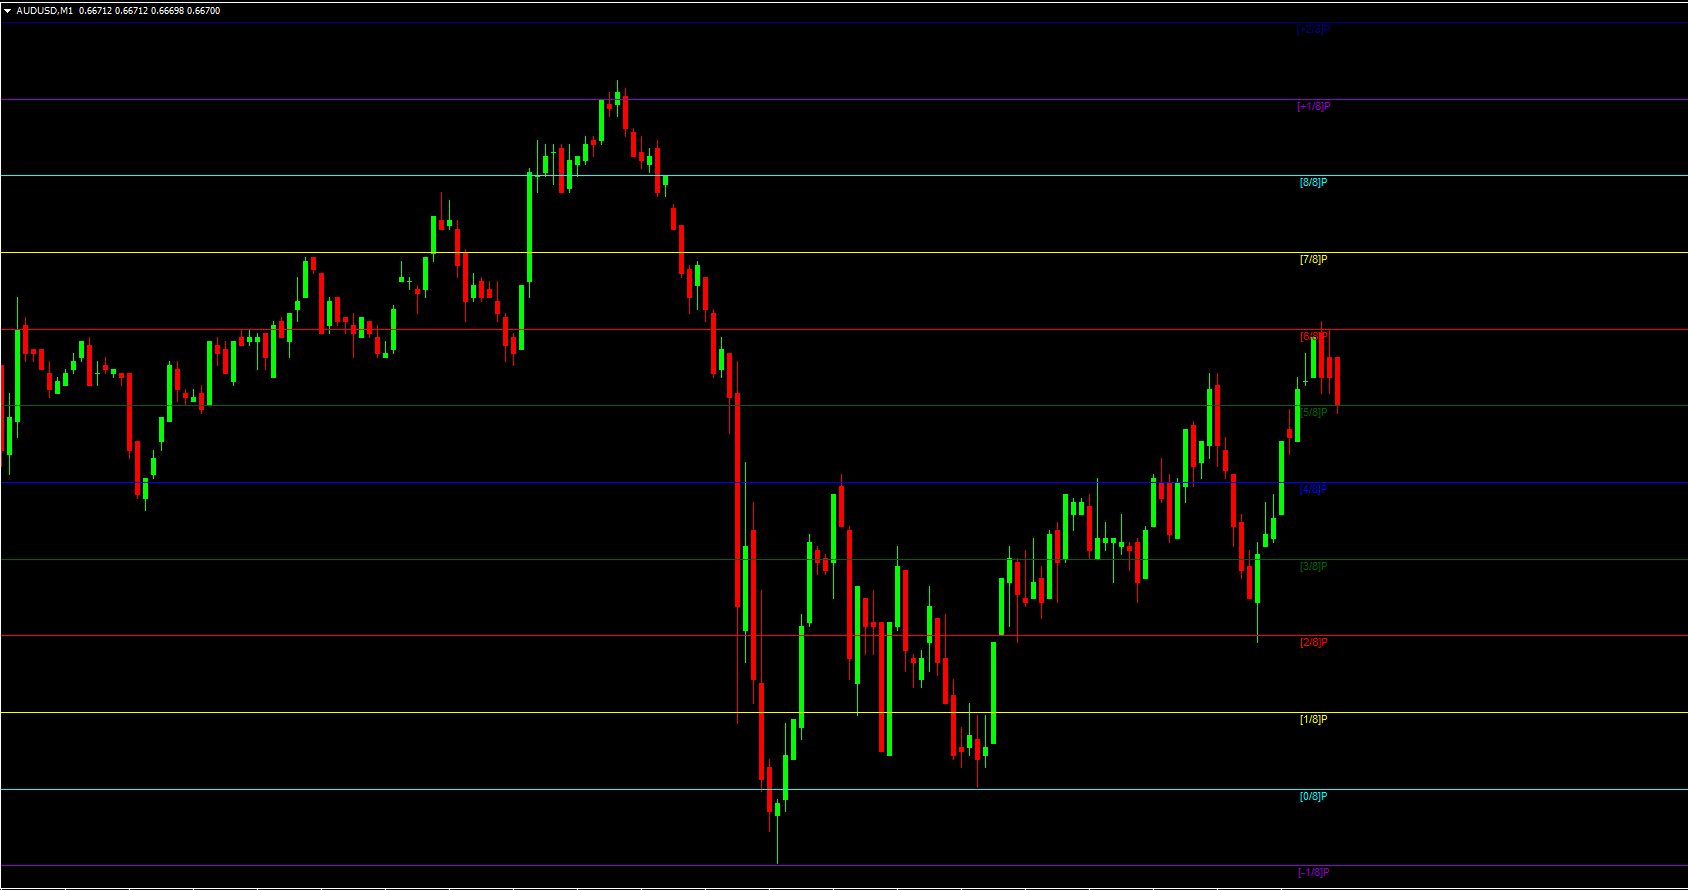
The indicator uses color-coded reference points, allowing traders to interpret chart conditions quickly. Understanding these line types is essential for maximizing the effectiveness of the Murrey Math MT VG indicator.
Ultimate Support and Resistance Lines
Color: Aqua
These represent the most important support and resistance levels.
Traders often use these as potential reversal zones and strong trade entries.
Overshoot and Extreme Overshoot Lines
Purple (Overshoot)
Blue (Extreme Overshoot)
Prices reaching these zones may indicate exhaustion or extended market conditions.
Pivot Reversal Levels
Color: Red
These lines show major pivot reversal support and resistance levels.
Price reacting strongly here confirms high-probability turning points.
Weaker Stall and Reversal Lines
Color: Yellow
These indicate minor stall zones where price may pause but not necessarily reverse.
Range Boundaries
Color: Green
These outline the upper and lower boundaries of the trading range.
When price respects these limits, the market is likely consolidating.
Market Interpretation Using the Indicator
The Murrey Math MT VG indicator helps traders determine whether the market is bullish or bearish based on the central pivot line.
Bullish Scenario
When price stays above the central pivot, it signals a bullish market condition.
A long (Buy) trade is considered when price reaches the lower Aqua support line.
Stop-loss: Slightly below the previous low.
Take-profit: Based on your risk-to-reward plan.
Bearish Scenario
When price stays below the central pivot, the market is bearish.
A short (Sell) trade is considered when price reaches the upper Aqua resistance line.
Stop-loss: Slightly above the previous high.
Take-profit: Adjusted to your preferred risk-to-reward strategy.
Practical Tips for Using the Murrey Math MT VG Indicator
Confirm Signals With Price Action
The indicator’s strength increases when combined with candlestick confirmation, trend analysis, or volatility indicators.
Combine With Algorithmic Trading Tools
Murrey Math calculations are mathematical in nature, making the indicator suitable for:
Algorithmic strategies
Backtesting software
Systematic trading setups
Forex trading course exercises
Technical analysis studies
Suitable for Forex, Indices, and Metals
Because it is based on pure price and mathematical structure, the indicator adapts well across asset classes.
Conclusion
The Murrey Math MT VG indicator for MT4 automatically calculates Murrey Math levels to identify essential support, resistance, and pivot lines. These reference points help traders spot accurate trade entries and exits using price action confirmation. When applied correctly, this indicator becomes a powerful tool for both manual and algorithmic trading strategies.
To explore more advanced trading tools, indicators, and resources, visit IndicatorForest.com.
FAQ
3 Downloads
Published:
Dec 10, 2025 21:53 PM
Category: