Decoding Pure Price Action: Trading Three Line Break Support & Resistance
In mainstream technical analysis, retail traders are bound to standard time-based candlestick intervals. Whether analyzing a 5-minute or a 30-minute chart, standard candlesticks print a new bar after a fixed period regardless of actual market activity. During periods of low volume or choppy consolidation, this creates massive market noise, prompting traders to overanalyze flat ranges and execute low-probability entries that lead to severe drawdown.
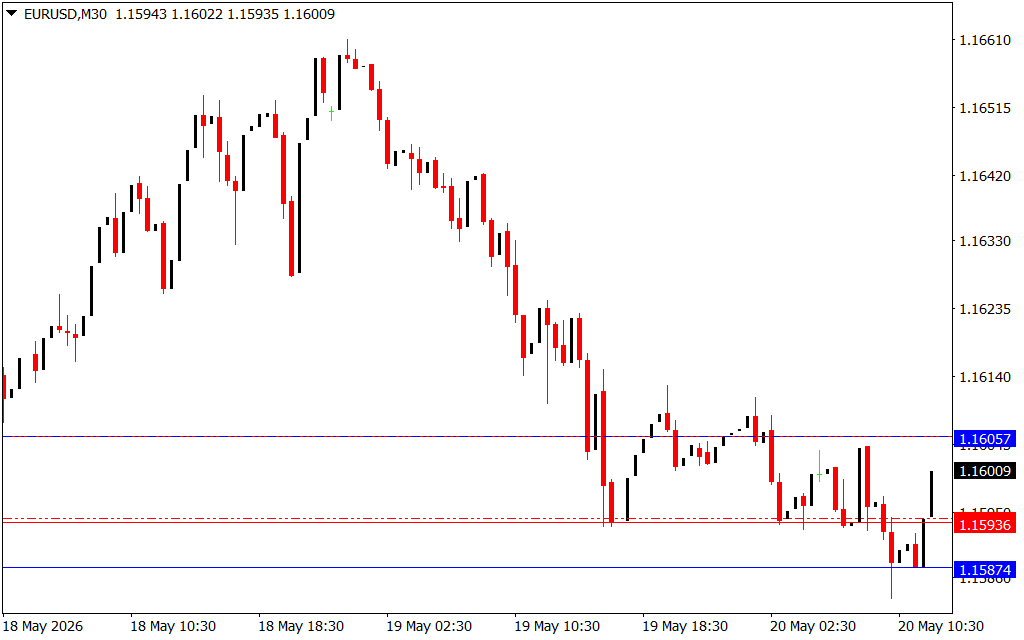
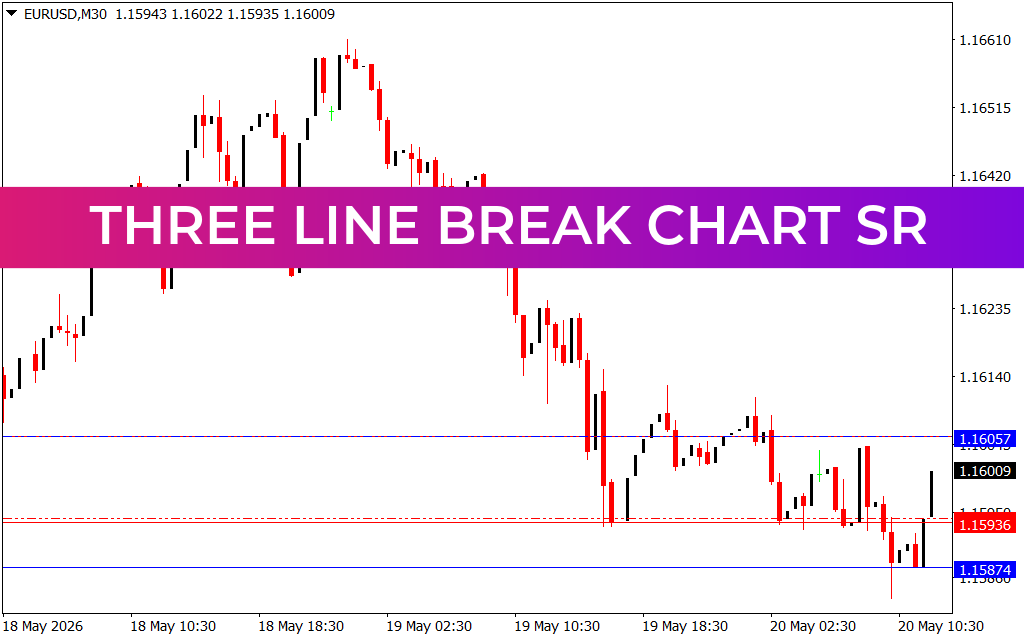
To bypass this chronological noise, advanced practitioners utilize a traditional Japanese charting method focused solely on price displacement. By eliminating time entirely, structural Support And Resistance levels become clear. On the EUR/USD 30-minute (M30) chart, we can observe the power of this structured framework as price drops from a distribution peak near 1.16610 into a steep institutional markdown phase, finding solid ground at the 1.15874 liquidity floor.
The Power of Price-Driven Structural Levels
The strategy displayed on this asset uses the advanced Three Line Break Chart SR system. Rather than drawing chaotic, subjective lines across every minor wick, this specialized algorithm calculates consecutive closing price reversals to uncover institutional Supply And Demand zones. A new line or key horizon is only generated when the current market price breaks beyond the high or low of the last three structural blocks, signaling a genuine shift in underlying order flow.
When analyzing this specific EUR/USD markdown and consolidation sequence, the system provides absolute technical clarity through three major horizontal lines:
- The Supply Ceiling (1.16057): This blue horizontal line marks the ultimate breakout boundary. For intraday swing traders, a clean expansion and candle close above this level provides confirmation that bulls have reassumed structural control, opening the door for sustained long entries.
- The Central Pivot (1.15936): Acting as the local equilibrium or mean-reversion line, this red dashed corridor captures the exact center of the accumulation phase. When price trades flatly around this line, it alerts traders to stand aside and avoid getting chopped up in non-directional noise.
- The Demand Floor (1.15874): Plotted precisely at the absolute bottom of the market cycle, this lower blue threshold marks a major institutional support level. When price sweeps this zone and fails to sustain a breakdown, it signals a high-probability V-shaped reversal setup.
Streamlining Your Trading Workflow
Attempting to track structural changes manually introduces heavy emotional bias and execution lag. Automating your support and resistance mapping using pure Price Action metrics ensures your risk parameters remain strictly mechanical. Integrating this professional three-line break indicator into your MetaTrader infrastructure strips away the distractions of minor candle wicks and time-based noise. This gives you clear targets, tight stop placements, and the technical edge needed to trade the global Forex markets with absolute confidence.
4 Downloads
Last Update:
May 20, 2026 15:56 PM
Published:
Jan 18, 2026 19:05 PM
Category: