Maximize Your Trading Precision with the Tvla Hilo Indicator
In the pursuit of consistent profitability, a trader's greatest ally is a clear understanding of Market Structure and volatility. Navigating the constant ebb and flow of price action requires tools that can distinguish between minor "noise" and significant trend shifts. The Tvla Hilo indicator is a professional-grade technical tool designed to solve this problem by plotting dynamic price channels based on historical highs and lows, providing an automated framework for trend identification and breakout trading.
Understanding the Logic of Tvla Hilo
The Tvla Hilo operates on the principle that market trends are defined by the breaking of established price boundaries. Instead of relying on a static moving average that can lag behind fast-moving markets, the Tvla Hilo creates a "step-like" channel around the Price Action.
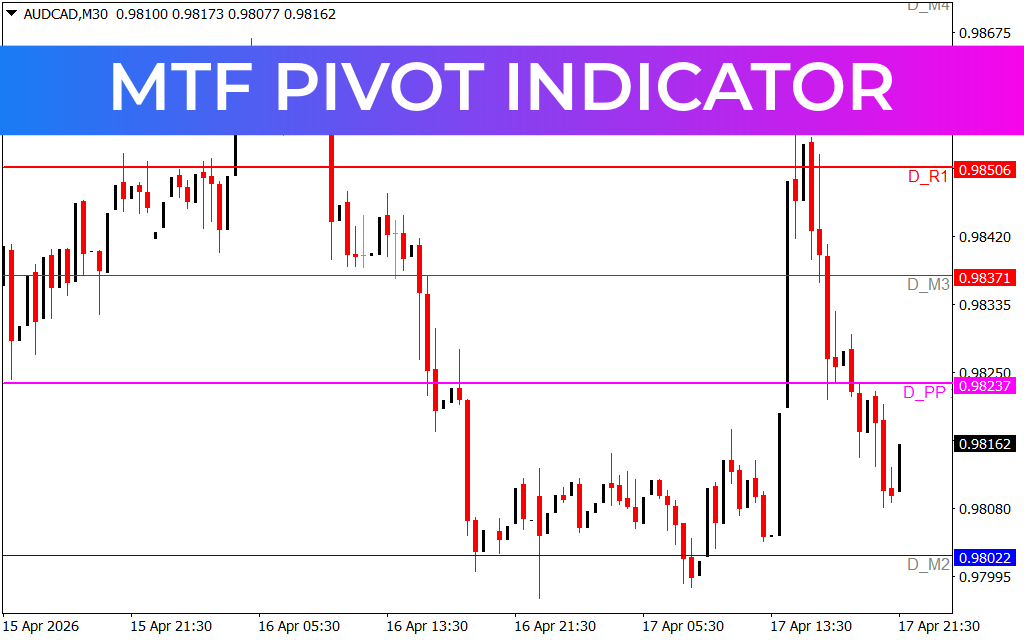
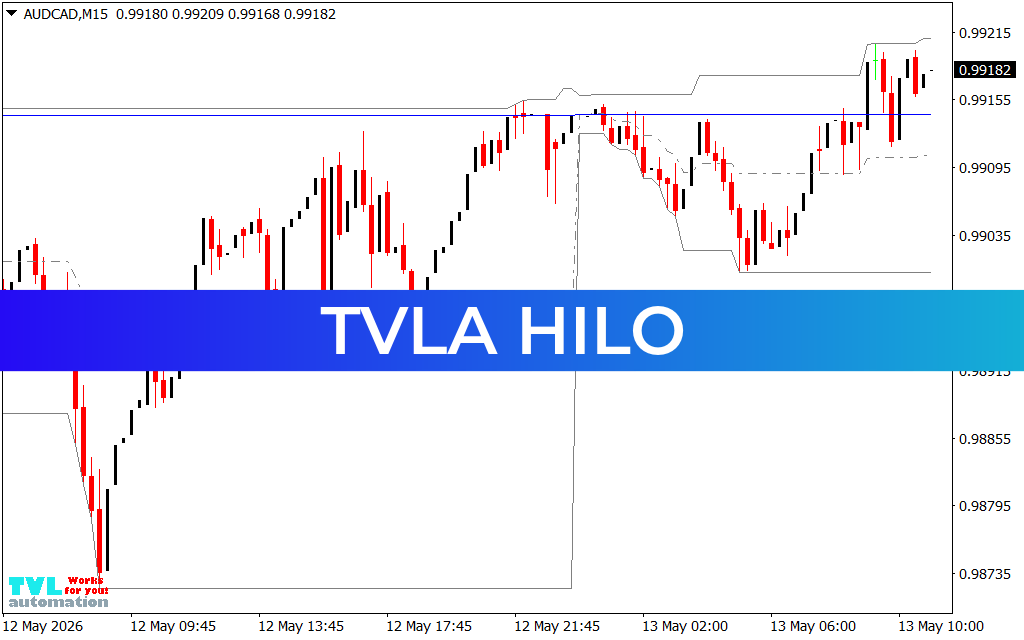
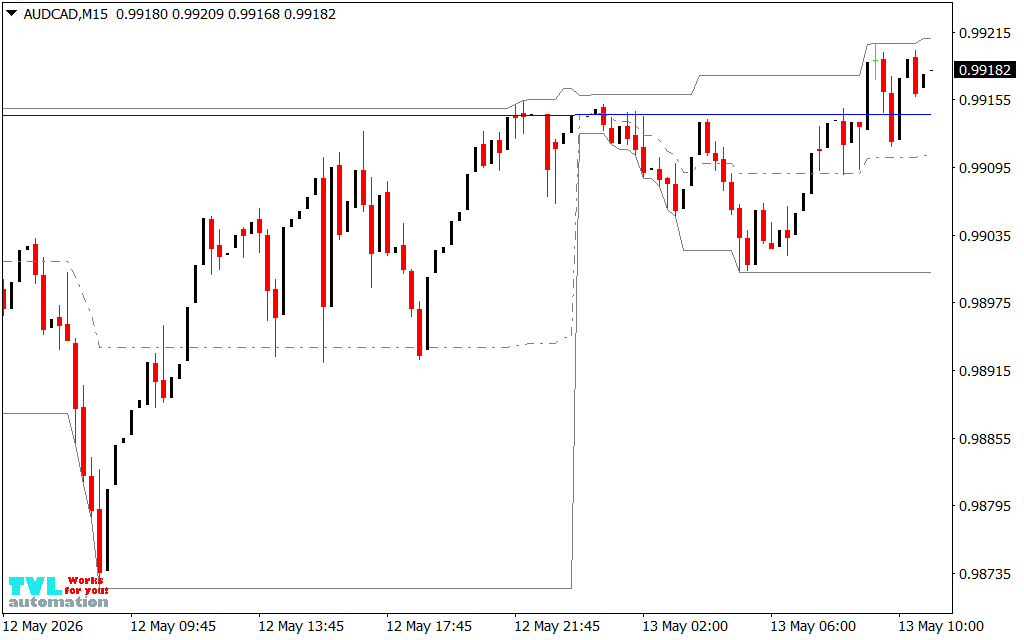
As demonstrated in the AUDCAD M15 chart, the indicator tracks the highest highs and lowest lows over a specific lookback period. This results in an upper and lower boundary that acts as a "containment zone" for price.
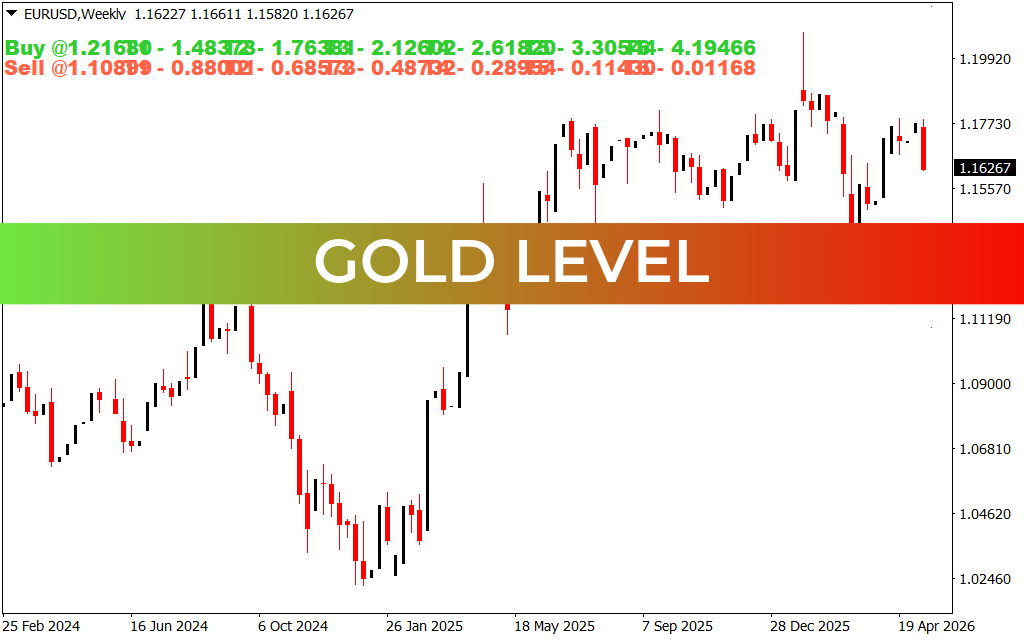
- The Upper Boundary: Represents a resistance zone. A sustained break above this level suggests that bullish momentum is accelerating.
- The Lower Boundary: Acts as a support floor. When price breaks through this level, it signals that the bears have taken control of the market structure.
Strategic Advantages for Day Traders
The Tvla Hilo is particularly popular among day traders and scalpers because it provides objective, "if-then" scenarios for trade execution.
- Trend Confirmation: The indicator creates a clear visual bias. When price is riding the upper boundary, the market is in a confirmed uptrend. When it hugs the lower boundary, the trend is bearish. This helps traders avoid the common mistake of "picking tops" in a strong trend.
- Breakout Precision: Many profitable strategies are built on breakouts. The Tvla Hilo identifies these high-velocity moments automatically. In the provided chart, notice how the indicator shifts its levels significantly as price enters a new trend phase, allowing the trader to capture the "meat" of the move.
- Dynamic Stop-Loss Placement: One of the most effective ways to manage risk is to trail your stop-loss behind the opposite boundary of the Tvla Hilo. This ensures that you stay in the trade as long as the trend is intact but are taken out as soon as the market structure shifts against you.
Integrating Tvla Hilo into a System
While the Tvla Hilo is powerful on its own, it excels when used as a core component of a multi-indicator strategy. For instance, a trader might wait for price to break the upper Tvla Hilo boundary on the EURUSD M15 while simultaneously checking the Corrected RSX for bullish momentum confirmation. By combining structural levels with momentum oscillators, you create a high-confluence system that professional traders use to gain an edge.
Conclusion
The Tvla Hilo is a fundamental tool for anyone looking to strip away market complexity and focus on pure price structure. It transforms raw data into actionable Support And Resistance levels that adapt in real-time. Whether you are a breakout specialist or a trend-follower, the Tvla Hilo provides the clarity and discipline needed to succeed in today’s markets.
4 Downloads
Last Update:
May 13, 2026 14:16 PM
Published:
Jan 23, 2026 01:23 AM
Category: