Master Strategic Support and Resistance with the MTF Pivot Indicator for MT4
In the world of professional technical analysis, floor pivots have long been considered the "gold standard" for identifying hidden areas of Supply And Demand. However, the modern trader faces a significant hurdle: a support level on a 5-minute chart may be completely irrelevant if it conflicts with a major resistance zone on a higher timeframe. The MTF Pivot Indicator for MetaTrader 4 (MT4) is a definitive technical solution designed to bridge this gap. By projecting Multi-Timeframe (MTF) pivot levels onto a single chart, it provides a comprehensive map of institutional price targets across various horizons.
The Power of Multi-Timeframe Confluence
Standard pivot points are calculated using the previous period's high, low, and close. While useful, they offer a narrow perspective. The MTF Pivot Indicator evolves this concept by allowing traders to visualize Daily, Weekly, and even Monthly pivot levels without ever leaving their preferred execution timeframe. This creates a "confluence of levels" where multiple timeframes agree on a single price point, significantly increasing the probability of a successful trade.
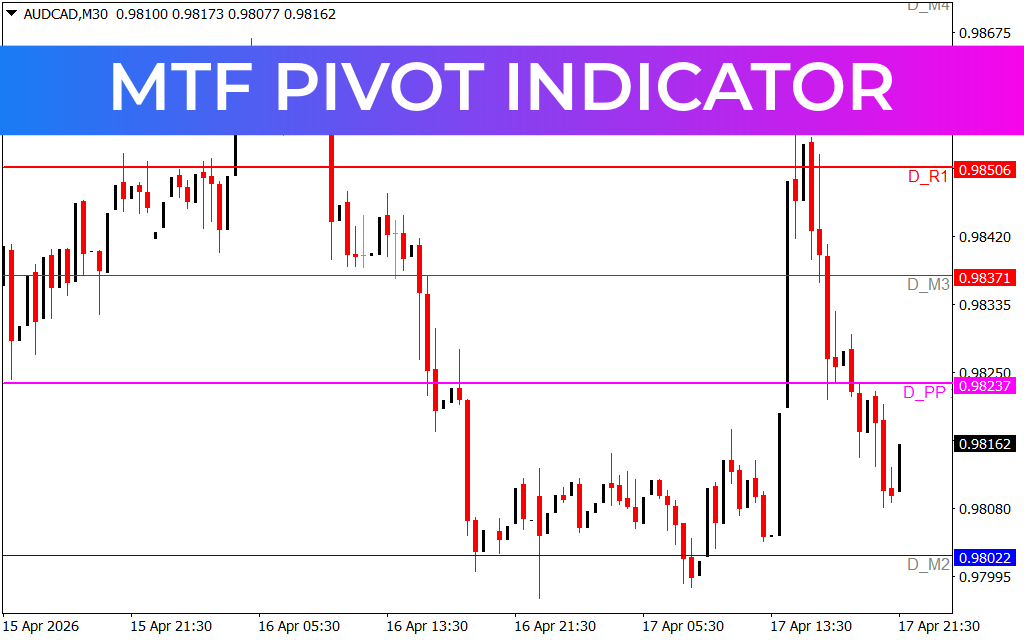
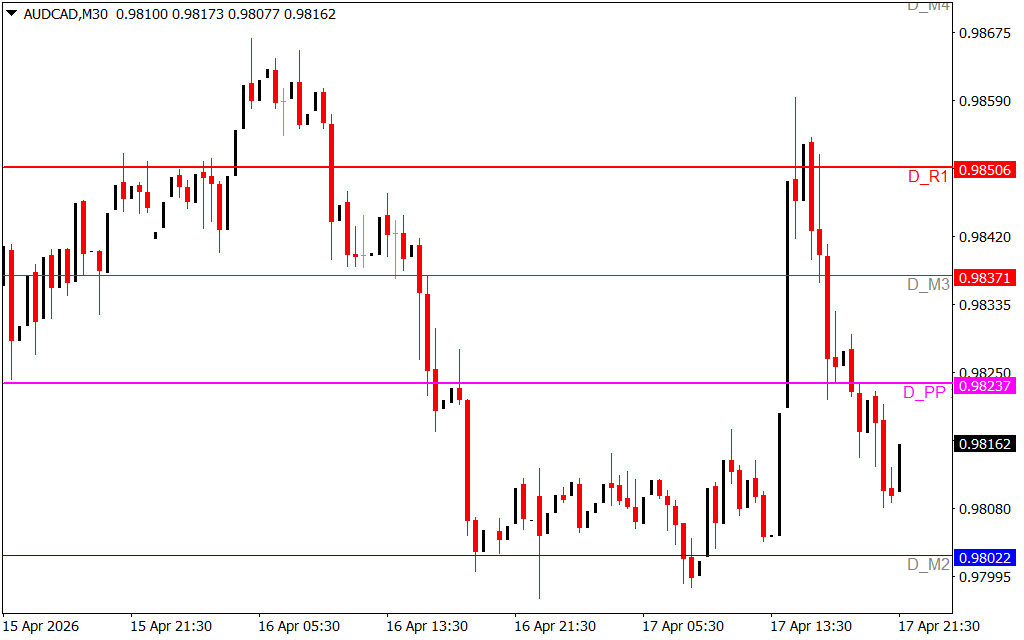
As demonstrated in technical analysis on complex price structures like AUD/CAD on the M30 timeframe, the MTF Pivot system provides several definitive operational advantages:
- Higher-Timeframe Anchoring: The indicator plots critical levels such as the Daily Pivot (D_PP), Daily Resistance (D_R1), and Daily Mid-points (D_M2, D_M3). As seen on recent M30 charts, price often treats these higher-timeframe levels as absolute barriers or magnets, regardless of lower-timeframe volatility.
- Surgical Entry Precision: By identifying where a 15-minute support level aligns with a Daily Pivot, traders can enter positions with tighter stop-losses and higher reward-to-risk ratios. These "confluence zones" represent the areas where institutional orders are most likely to be clustered.
- Unified Market Context: The indicator acts as a visual dashboard, color-coding different levels (e.g., magenta for the central pivot, red for resistance, and blue for support). This allows for a grounded, professional assessment of the market regime—whether it is trending between levels or trapped in a range—in just a single glance.
- Dynamic Target Selection: Instead of guessing where a trend might end, the MTF Pivot levels provide objective take-profit targets. If price breaks above the Daily Pivot, the D_R1 level becomes the next logical mathematical destination.
Strategic Implementation for Systematic Traders
The MTF Pivot Indicator is an essential asset for any trader who values a disciplined, geometric approach to the financial markets.
- The Pivot Bounce: Watch for price to approach a Daily or Weekly Pivot level. If Price Action shows a rejection candle (such as a pin bar) at these levels, it offers a high-probability reversal setup based on institutional "fair value."
- Breakout and Retest: When price aggressively breaks through a resistance level like D_R1, wait for a pullback to retest that same level as new support. This "role reversal" is a hallmark of strong trending markets.
- Cross-Timeframe Synergy: Align your intraday bias with the Daily Pivot. If price is trading above the Daily Pivot, prioritize long setups at lower-timeframe support levels to ensure you are trading with the path of least resistance.
Conclusion
The MTF Pivot Indicator for MT4 is a definitive tool for traders who demand institutional-grade oversight and mathematical precision. By bridging the gap between intraday fluctuations and higher-timeframe structural levels, it empowers you to navigate the markets with grounded, professional confidence. Elevate your technical analysis today and master market geometry with the MTF Pivot system.
8 Downloads
Last Update:
Apr 18, 2026 22:43 PM
Published:
Feb 04, 2026 13:51 PM
Category: