The Volume at Price Indicator (VAP) is a professional tool for Forex traders who want to understand the real story behind market movements. Instead of relying on lagging signals, this indicator combines volume data with Price Action to highlight key areas of buying and selling pressure.

In the complex world of Forex, volume plays a critical role. The VAP indicator simplifies this analysis by showing how much trading activity occurs at specific price levels — revealing the true strength behind each move. Whether you’re a beginner or an experienced trader, this tool helps you make better, more informed decisions.
Why Volume Analysis Matters in Forex
Volume shows the participation of market players — the energy behind every candle. While most traders focus on price patterns, professionals combine price + volume to identify smart money actions, potential reversals, or continuation zones.
The Volume at Price Indicator bridges this gap by visualizing where the majority of orders are clustered. These “volume nodes” often act as support and resistance levels, helping traders plan accurate entries and exits.
Main Features of the Volume at Price Indicator
This MT4 indicator stands out because it includes a range of built-in price-volume patterns that help identify market sentiment and possible turning points. Among them are:
Upthrust & Reverse Upthrust
Pseudo Upthrust & Reverse Pseudo Upthrust
Stopping Volume (High/Low)
Buying Climax / Selling Climax
High Churn Zones
No Supply / No Demand Bars
Strength & Weakness Patterns (A & B)
Each of these patterns provides unique insights into the balance between Supply And Demand.
Multiple Display Modes for Different Strategies
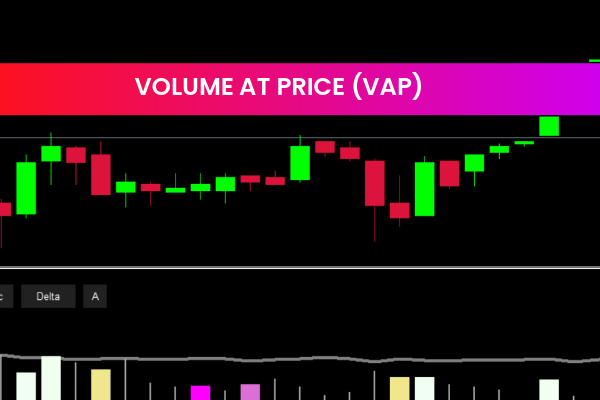
The VAP Indicator comes with four visual modes — VSA, PVA, Classic, and Delta. By pressing the “A” button, users can label patterns directly on the price chart with matching colors and names. This feature helps you minimize indicator clutter and focus on price action itself.
Additionally, the indicator displays the current pattern name and color in the top-right corner of the panel. If you see “Not value,” it simply means the current bar doesn’t match any predefined pattern — a helpful filter to avoid false interpretations.
Predictive Volume Projections
One of the most advanced features of the VAP Indicator is its ability to forecast future volume activity. Using historical data, the indicator projects possible upcoming volume behavior. You can customize these predictions in the settings, making the tool adaptable to your trading style — whether you’re Scalping or swing trading.
How to Trade Using the VAP Indicator
Unlike basic buy/sell systems, the Volume at Price Indicator highlights critical interactions between price and volume. When you see a “Buying Climax,” for example, it often signals the end of an uptrend and possible start of distribution.
Similarly, “No Supply” bars can indicate a potential bullish reversal. These patterns are cornerstones of Volume Spread Analysis (VSA) — a technique used by professionals to understand smart money accumulation and distribution phases.
By learning to read these signals, traders can enter earlier than the crowd and manage risk with higher precision.
Why Choose Volume at Price from IndicatorForest.com
At IndicatorForest.com, we provide tested, premium-quality indicators designed for real trading results — not just visual appeal. The Volume at Price Indicator is part of our professional series, optimized for MT4 and suitable for all timeframes and pairs.
If you’re serious about improving your market analysis, download this tool today and start trading with data-driven confidence.
👉 Visit IndicatorForest.com to explore more advanced Forex indicators and strategies designed to maximize your edge in the market.
12 Downloads
Published:
Dec 28, 2025 09:33 AM
Category: