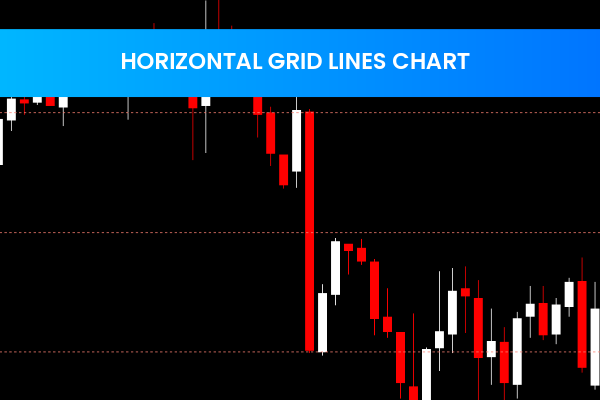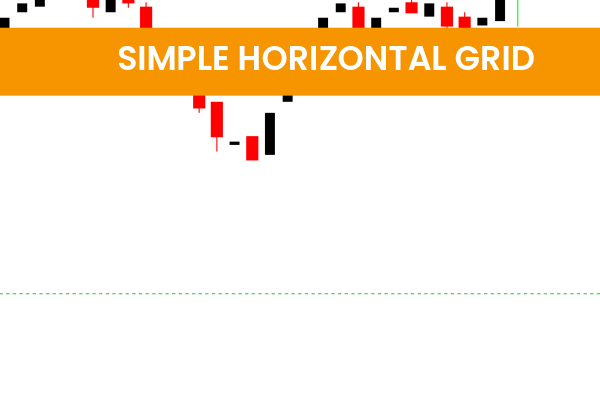
The Simple Horizontal Grid Indicator is a popular and free Forex Indicator for the MetaTrader 4 (MT4) trading platform. It is designed to help traders quickly identify key Support And Resistance levels, as well as potential entry and exit points for trades.

By plotting horizontal lines on the chart, the indicator provides a clear visual guide of important price levels based on the previous day’s high, low, open, and close prices. This makes it easier for traders to make informed decisions in any market conditions.
How the Simple Horizontal Grid Indicator Works
The indicator works by plotting horizontal lines on your MT4 chart, including:
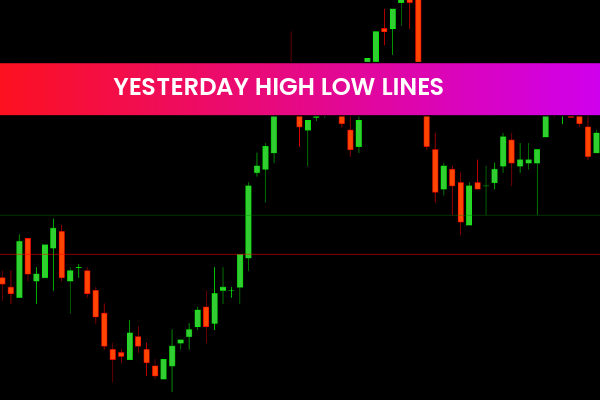
Previous Day High
Previous Day Low
Previous Day Open
Previous Day Close
These lines act as dynamic support and resistance levels, helping traders identify:
Potential reversal points
Possible breakout zones
Optimal stop-loss and take-profit placement
By using these levels, traders can gain a clearer understanding of market dynamics and better manage risk.
Key Features
Daily Price Levels: Automatically plots lines for previous day’s high, low, open, and close.
Support and Resistance: Highlights key price zones where reversals or breakouts may occur.
Trade Management: Helps set stop-loss and take-profit levels accurately.
Customizable: Adjust colors, line styles, and thickness to fit your chart layout.
Easy to Use: Works on any MT4 chart and any currency pair.
Free Indicator: Available at no cost for all MT4 traders.
Benefits of Using the Simple Horizontal Grid Indicator
Quickly identify high-probability trading areas
Visualize support and resistance levels without manual calculations
Plan trades with better risk management using clear stop-loss and take-profit levels
Enhance trading strategies by combining with trend or momentum indicators
Suitable for novice and experienced traders alike trend
The indicator is especially useful for day traders and scalpers who rely on daily price levels to plan their trades.
Installation and Setup
Download the Simple Horizontal Grid Indicator file.
Copy it to the Indicators folder of your MT4 platform.
Open MT4, attach the indicator to any chart, and customize the settings.
The indicator will automatically plot the previous day’s high, low, open, and close lines on your chart.
Once installed, the Simple Horizontal Grid Indicator provides instant visual guidance, making it easier to signal spot potential trading opportunities and manage risk.
Final Thoughts
The Simple Horizontal Grid Indicator for MT4 is a powerful yet easy-to-use tool for Forex traders. By highlighting key support and resistance levels, it helps traders identify potential entry and exit points, as well as place stop-loss and take-profit orders effectively. Its simplicity, free availability, and customization options make it one of the most popular MT4 indicators for traders of all experience levels.
Published:
Jan 07, 2026 17:05 PM
Category: