The Yesterday High Low Lines Indicator for MT4 is a powerful forex tool designed to automatically plot horizontal lines at the previous day’s high and low price levels. These levels act as strong Support And Resistance zones, helping traders make informed buy or sell decisions.

By using this indicator, traders can instantly identify potential breakout and reversal opportunities, improving their market timing and precision. Whether you’re a beginner or an experienced trader, this indicator simplifies technical analysis and supports consistent trading performance.
How the Indicator Works
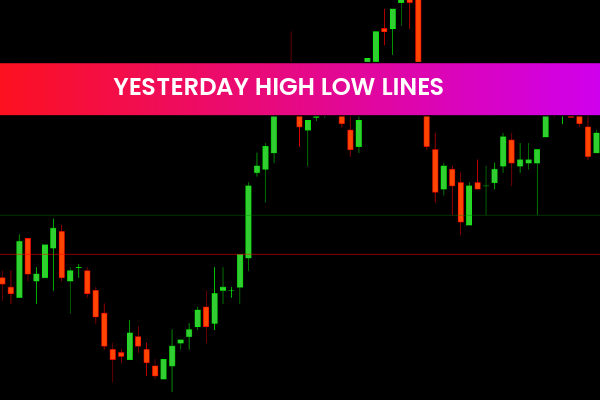
The Yesterday High Low Lines Indicator scans the previous trading day and plots two horizontal lines on the price chart:
High Line (Resistance) – Marked in green, it represents the highest price reached yesterday.
Low Line (Support) – Marked in red, it represents the lowest price reached yesterday.
These lines remain visible throughout the current trading session, allowing traders to gauge market reactions as the price approaches or breaks these levels.
Since support and resistance levels are essential in Price Action Trading, this indicator provides a visual and automatic way to identify them.
Best Chart Settings and Usage
For the most accurate results, the Yesterday High Low Lines Indicator for MT4 should be applied on the daily chart (D1). This ensures the indicator correctly identifies the previous day’s high and low levels without misalignment.
Once the levels are drawn, traders can manually mark them on lower timeframes (such as M15, M30, or H1) for more precise trade entries.
This method is especially useful for day traders and scalpers who want to capture market movements near the breakout zones.
Trading Strategies Using Yesterday High Low Lines Indicator
There are two main trading approaches using the Yesterday High Low Lines Indicator:
Breakout Strategy
When the current price breaks above the previous day’s high, it signals bullish momentum. Traders can enter a buy trade, placing stop-loss orders below the breakout level.
Conversely, if the price breaks below the previous day’s low, it indicates bearish momentum, and traders can initiate sell trades with stop-loss orders above the breakout.
Reversal or Fake Breakout Strategy
Sometimes, prices may temporarily break a level and reverse quickly — this is known as a false breakout. In such cases, traders wait for confirmation (like a rejection candle or a return below the line) before entering trades in the opposite direction.
This approach helps capture profitable reversals while minimizing risk.
Advantages of Using Yesterday High Low Lines Indicator
Automatic support and resistance detection
Time-saving — no need for manual plotting every day
Works for all currency pairs and assets
Enhances accuracy of breakout and trend strategies
Suitable for all trader levels
By using this indicator, traders gain a clearer picture of market structure, leading to smarter decision-making and improved consistency.
Pro Tips for Best Results
Use the indicator with confirming tools like Moving Averages, RSI, or MACD for stronger trade confirmation.
Always wait for a clear breakout candle before entering trades.
Combine with price action patterns such as pin bars or engulfing candles to validate entries.
Conclusion
In summary, the Yesterday High Low Lines Indicator for MT4 automatically plots the previous day’s support and resistance levels, providing a reliable reference for trading decisions. It’s a must-have tool for identifying daily market bias, breakout points, and reversal zones.
Ready to enhance your trading accuracy? Download the Yesterday High Low Lines Indicator for MT4 now at IndicatorForest.com and start mastering your daily market analysis.
4 Downloads
Published:
Dec 27, 2025 18:28 PM
Category: