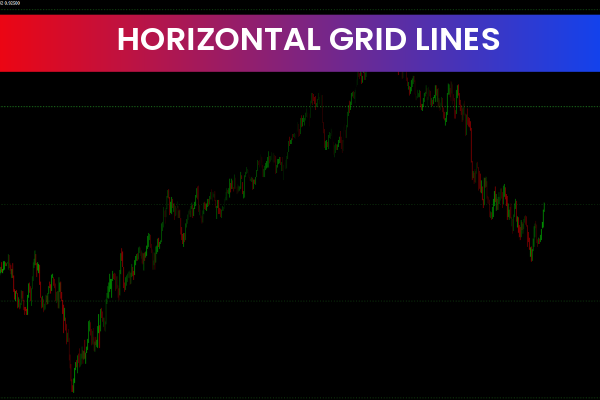
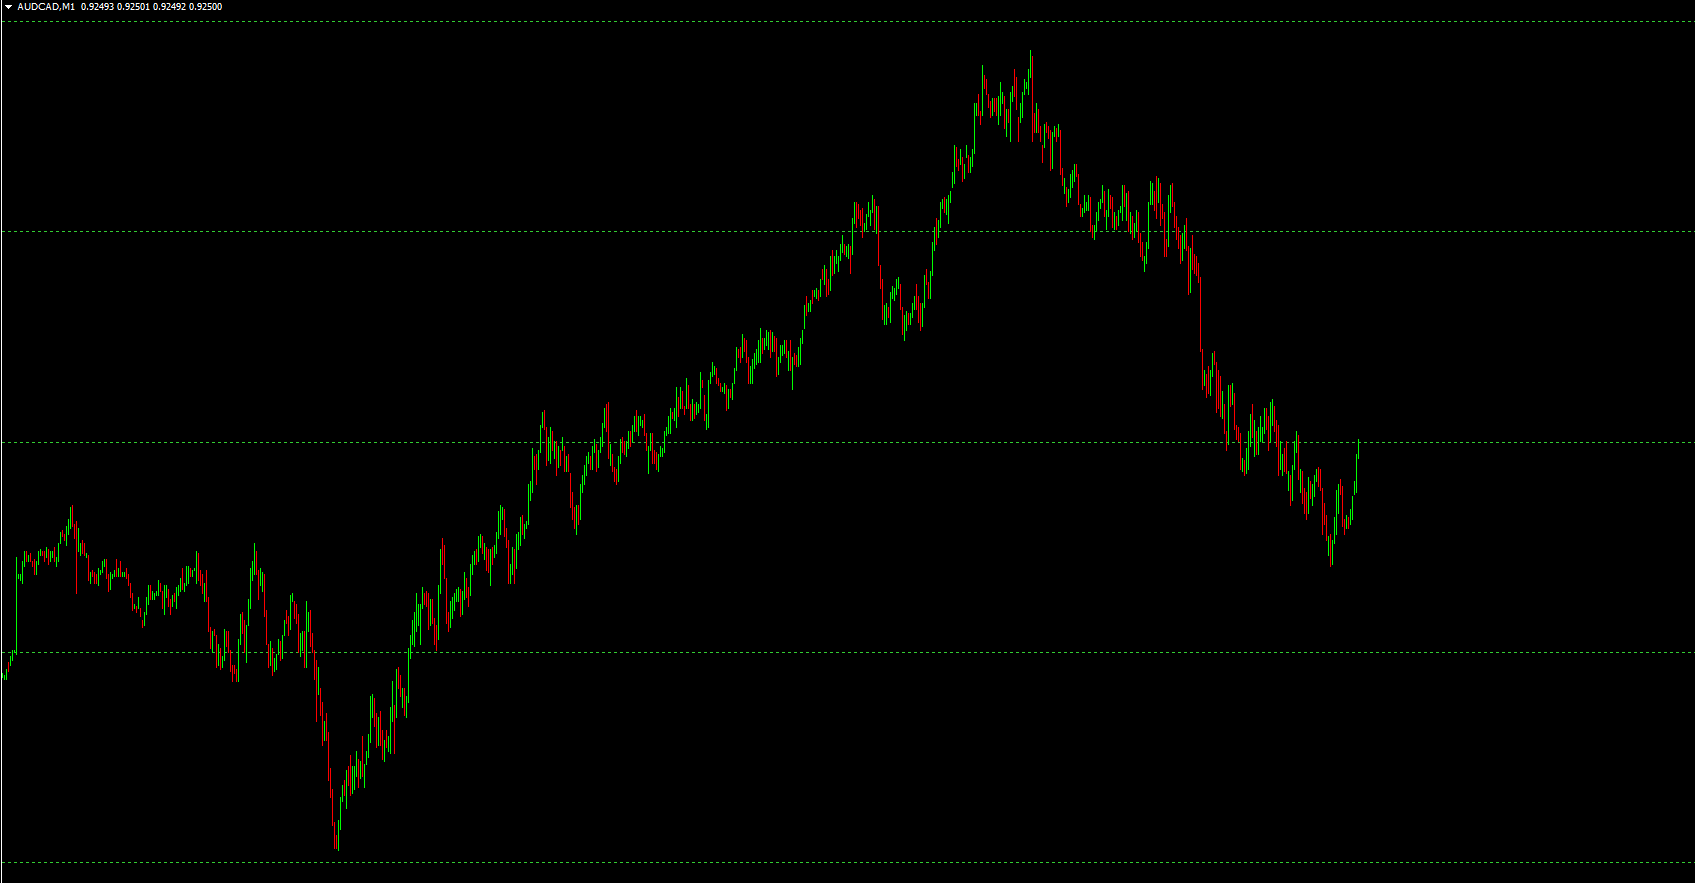
The Horizontal Grid Lines Indicator is a popular and free Forex tool for the MetaTrader 4 (MT4) platform. It is designed to help traders identify potential support and resistance levels by drawing horizontal grid lines across the chart. These lines allow traders to quickly spot price levels where the market may reverse or consolidate, making it easier to make informed trading decisions.
Suitable for traders of all skill levels, this indicator is simple to use and highly customizable, making it an essential addition to any MT4 trading setup.
How the Horizontal Grid Lines Indicator Works
The Horizontal Grid Lines Indicator automatically draws horizontal lines at regular price intervals on your MT4 chart. These lines can represent potential areas of:
Support – Price levels where the market tends to stop falling and may bounce higher.
Resistance – Price levels where the market tends to stop rising and may reverse downward.
By visually displaying these levels, traders can anticipate possible market reversals and adjust their entry and exit points accordingly.
Key Features of the Horizontal Grid Lines Indicator
Automatic Grid Drawing
Creates horizontal lines across the chart at regular intervals.
Customizable Settings
Adjust the number of lines, distance between lines, and line color.
Support And Resistance Detection
Helps identify potential reversal and consolidation areas.
Easy to Use
Drag and drop onto any MT4 chart for instant visualization.
Free and Accessible
Available for free on the MT4 platform for all Forex traders.
How the Horizontal Grid Lines Indicator Can Benefit You
Identify Key Price Levels
Quickly determine areas where the market may reverse or stall.
Improve Trading Decisions
Use grid lines to plan entries, exits, and stop-loss placements.
Save Time on Analysis
Automatically draws lines, eliminating the need for manual support/resistance plotting.
Adaptable for Any Trading Strategy
Useful for day trading, swing trading, and Scalping.
Enhance Market Awareness
Helps traders anticipate price reactions at critical levels.
How to Use the Horizontal Grid Lines Indicator Effectively
Add the indicator to your MT4 chart.
Adjust the settings to suit your preferred grid spacing and number of lines.
Observe Price Action relative to the horizontal grid lines.
Use the lines to confirm support and resistance levels before entering trades.
Combine with trend indicators, oscillators, or candlestick patterns for better confirmation.
By incorporating these grid lines into your trading strategy, you can improve precision in identifying high-probability trading opportunities.
Why Traders Choose the Horizontal Grid Lines Indicator
Traders choose this indicator for its simplicity, effectiveness, and time-saving features. By providing a clear visual representation of potential support and resistance levels, the Horizontal Grid Lines Indicator helps traders make informed decisions without cluttering the chart.
For more free MT4 indicators and professional Forex trading tools, visit IndicatorForest.com to explore a wide range of trading resources.
Final Thoughts
The Horizontal Grid Lines Indicator is a versatile MT4 Forex tool that helps traders identify potential support and resistance levels and anticipate market reversals. Its easy installation, customizable settings, and automated grid drawing make it suitable for both novice and experienced traders.
Call to Action:
Discover more free MT4 Forex indicators and improve your trading strategies today at IndicatorForest.com.
1 Download
Published:
Jan 06, 2026 14:43 PM
Category: