Mastering Cyclic Market Trends with the Hurst Bands Indicator
Financial markets fluctuate in highly repetitive, rhythmic patterns rather than random movements. While classic moving averages often fail because they treat all data linearly, advanced technical strategies focus on isolating these recurring market frequencies. This cyclical methodology was perfected by American engineer J.M. Hurst, who discovered that Price Action is driven by a composite of underlying cycles.
The Hurst Bands indicator brings this powerful cyclical logic directly into MetaTrader, translating complex time-cycle formulas into highly actionable visual trends.
What is the Hurst Bands Indicator?
The Hurst Bands indicator is a sophisticated technical tool engineered to track asset cycles and market momentum. Unlike standard trend filters that lag significantly behind the current price, this indicator attempts to account for the market's natural rhythm.
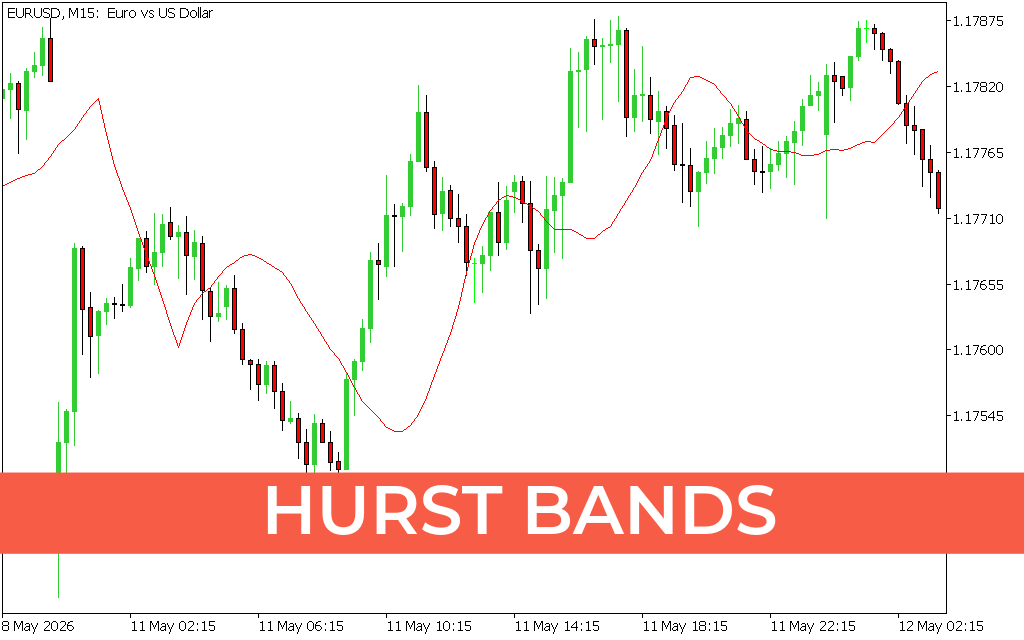
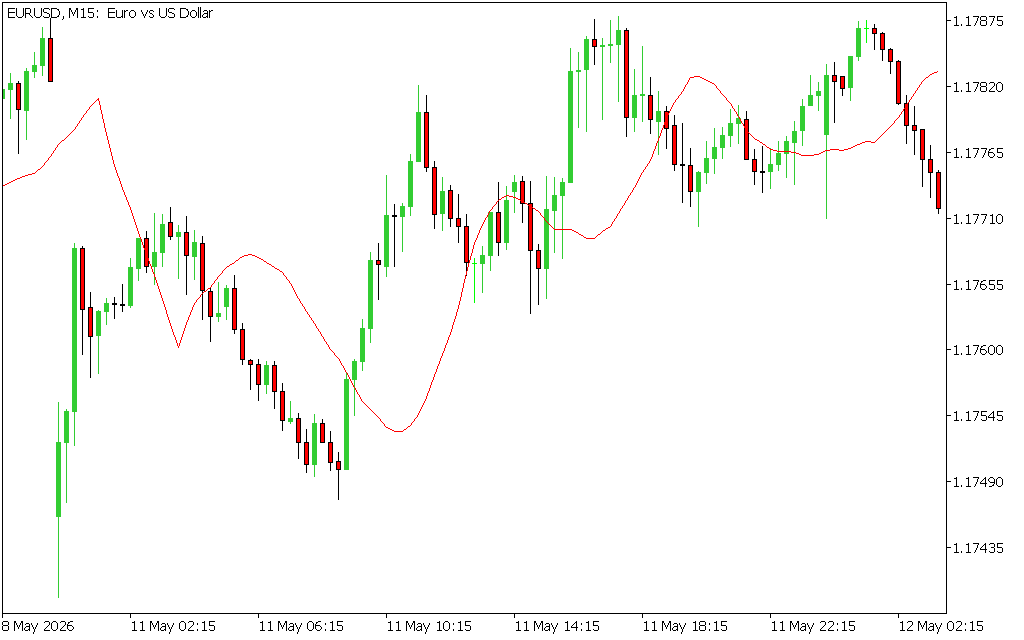
As displayed on the EURUSD M15 chart, the indicator tracks price using a smooth, dynamic red trend line that shifts rapidly according to shifting market frequencies. By filtering out erratic price noise and focusing purely on dominant cycles, it gives traders an objective view of whether a market is in an accumulation phase, an expansion phase, or preparing for a major Trend Reversal.
Key Benefits and Core Features
- Cyclic Trend Analysis: Instead of relying on rigid, arbitrary mathematical intervals, the indicator models its path based on repetitive price frequencies.
- Reduced Lag and Smooth Filtering: The underlying calculations adapt dynamically to current market conditions, smoothing out deceptive candlestick spikes while staying close to the core trend.
- Clear Directional Changes: The sharp shifts in the red indicator line make it incredibly easy to see when a currency pair is transferring from a bearish cycle into a bullish one.
- Multi-Timeframe Versatility: The tool works perfectly on short-term intraday charts like the 15-minute layout, as well as macro daily and weekly perspectives for swing trading.
How to Trade Using Hurst Bands
Trading with the Hurst Bands indicator centers on identifying shifts in cyclical momentum. When the EURUSD price breaks and stays conclusively above the red trend line while the line itself shifts upward, it confirms a dominant bullish market cycle. Traders can confidently use this alignment to hunt for pullbacks to buy the market.
Conversely, when the candlesticks fall below the indicator line and the slope bends downward, it warns of an impending bearish phase. By combining this tool with cyclical envelopes or channels, traders can effectively pinpoint macro peaks and valleys, establishing tight risk-to-reward parameters and objective profit targets based on established market cycles.
2 Downloads
Last Update:
May 23, 2026 01:26 AM
Published:
Jan 17, 2026 13:52 PM
Category: