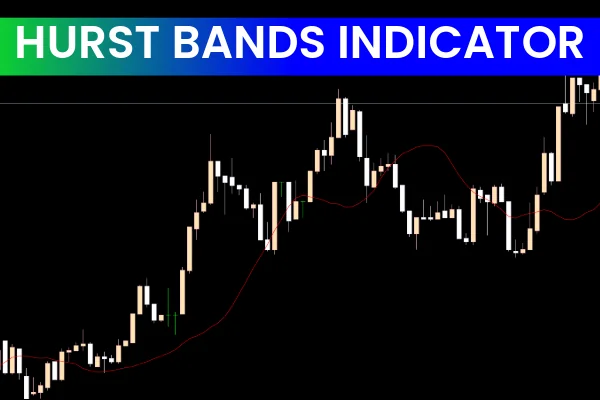
The Hurst Bands Indicator for MT5 is a powerful technical tool designed to identify dynamic Support And Resistance levels across multiple timeframes. It helps traders analyze market highs and lows, evaluate trend direction, and locate the best pullback opportunities. Although the indicator does not generate automatic BUY or SELL signals, it equips traders with highly accurate price zones to evaluate trade decisions based on Price Action and candlestick formations.
What Makes the Hurst Bands Indicator Useful?
Hurst Bands is a versatile price-channel indicator that builds a seven-band structure around the market. These bands illustrate potential zones where the price may stall, bounce, or reverse. By tracking market highs, lows, and mid-level movements, the indicator provides a clear visual map of future retracement levels and dynamic trend behavior.
Traders use the Hurst Bands Indicator for MT5 in both Forex and stock markets. It is especially helpful for multi-timeframe (MTF) analysis, allowing you to see market pressure points that align across different chart periods. This makes it a valuable tool for algorithmic trading, day trading, and swing trading in MetaTrader 5.
Key Features
Seven-band dynamic price channel
Built-in trend line for directional bias
Identifies retracement and continuation levels
Works on Forex, stocks, indices, and crypto
Supports MTF analysis for accurate decision-making
Ideal for both novice and advanced traders
How to Spot Accurate Buy-Sell Zones Using the Hurst Bands Indicator
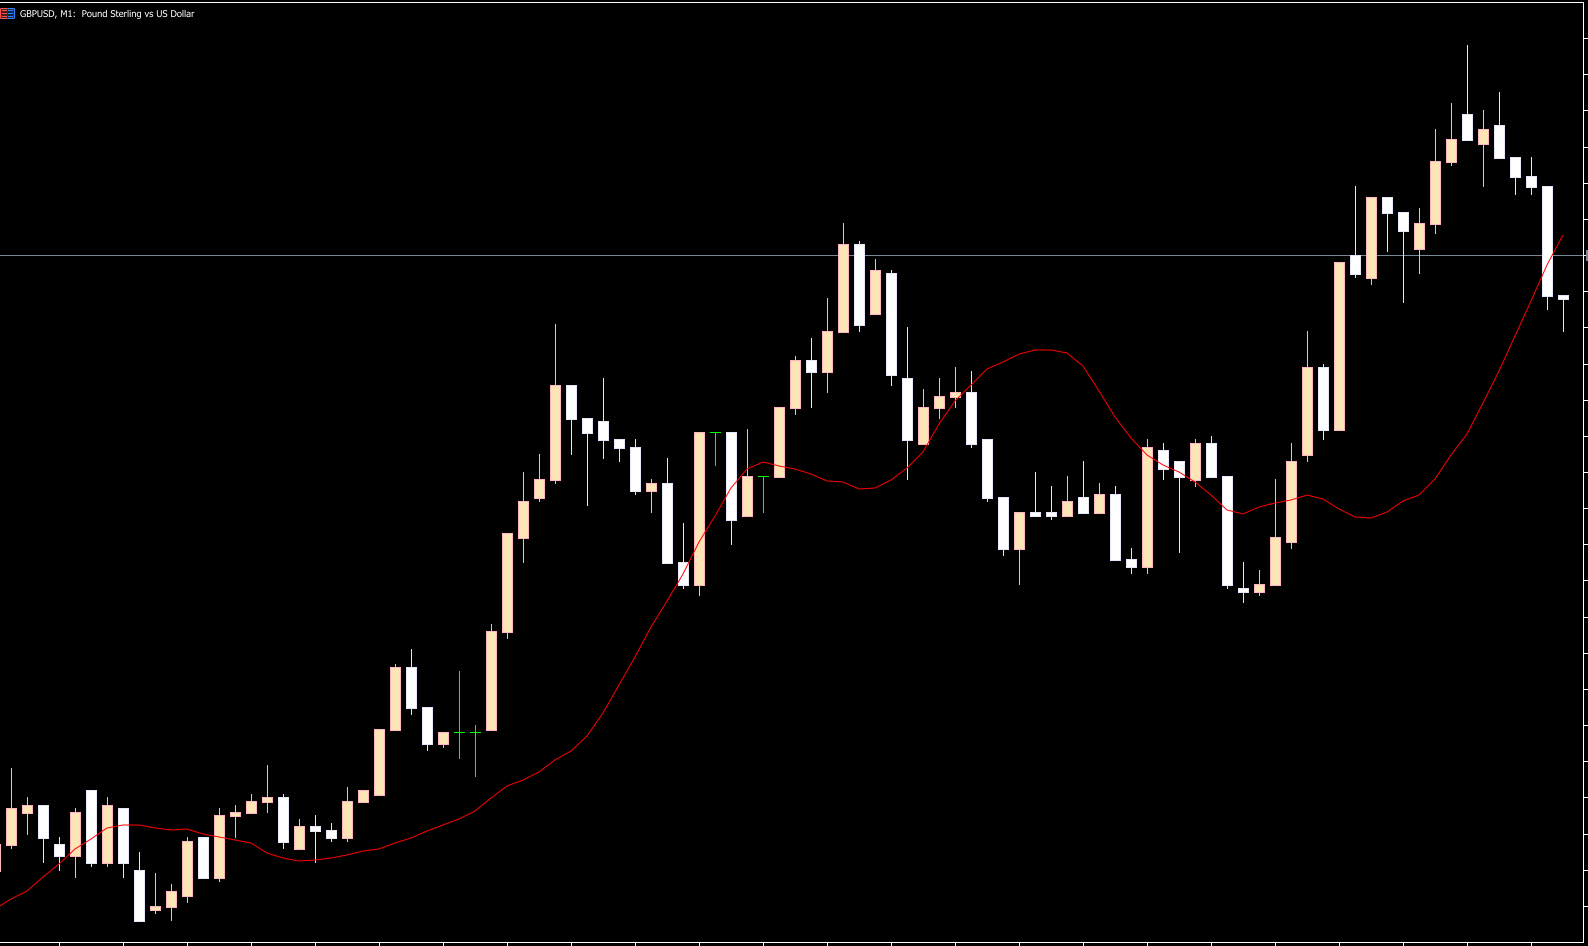
The Hurst Bands indicator creates a structured price channel consisting of upper, middle, and lower levels. Traders evaluate how the price interacts with these zones to forecast market behavior.
During a bullish trend, prices usually:
Refuse to break below the lower channel
Stay above the middle band
Create higher lows near channel support
During a bearish trend, prices typically:
Reject the upper channel
Hold below the middle channel
Form lower highs at resistance
Example: Bearish Price Action Setup
In the EUR/USD chart example, price first rejected a move above the upper channel, signaling a potential bearish shift. Later, a large bearish candle broke below the middle band, confirming downtrend momentum.
A strong SELL opportunity appears when:
Price forms a lower high near channel resistance.
Price rejects upper-channel resistance.
A candle breaks below the middle band.
This creates an ideal setup to open a short position.
Example: Bullish Price Action Setup
For long trades, look for price to respect channel support. In the example case, price formed a false breakout below the lower channel and followed with a bullish pin bar above the lower band—an early sign of bullish momentum.
A BUY opportunity forms when:
Price holds above lower-channel support.
A bullish reversal pattern appears (pin bar, engulfing, etc.).
Price moves above the middle channel.
Entering as price breaks the mid-channel level increases the probability of a Trend Reversal or continuation.
Using Hurst Bands for Stop Loss Placement
The Hurst Bands indicator also provides logical and technical stop loss positions:
Long trades: place stop loss below the lower channel.
Short trades: place stop loss above the upper channel.
This ensures stops are positioned beyond strong dynamic levels, reducing the risk of premature exits.
Conclusion
The Hurst Bands Indicator for MT5 is one of the best tools for automatic price-level analysis. It helps traders track highs and lows, interpret trend direction, and identify reliable buy and sell zones across multiple timeframes. When paired with additional MetaTrader indicators such as MACD, RSI, or Stochastic Oscillators, the Hurst Bands Indicator becomes even more powerful for confirming trade setups.
For more premium indicators and forex tools, visit IndicatorForest.com.
FAQ
Published:
Dec 10, 2025 08:40 AM
Category: