The Real Cloud Indicator for MT5 is a moving average–based trading system designed to deliver clear bullish and bearish trend signals. It combines two key moving averages — the 9-period and 76-period MAs — to generate actionable entry and exit points for forex traders.
What makes this indicator unique is its multi-timeframe flexibility (MTF) and visual clarity. Traders can customize moving averages for different timeframes, allowing one MA to represent a higher timeframe trend while the other tracks the current timeframe for dynamic crossovers.
This adaptability makes the Real Cloud Indicator suitable for both new and experienced traders. It performs effectively across all chart types — including intraday, daily, weekly, and monthly setups — offering traders of all levels an efficient way to follow the market trend.
How the Real Cloud Indicator for MT5 Works
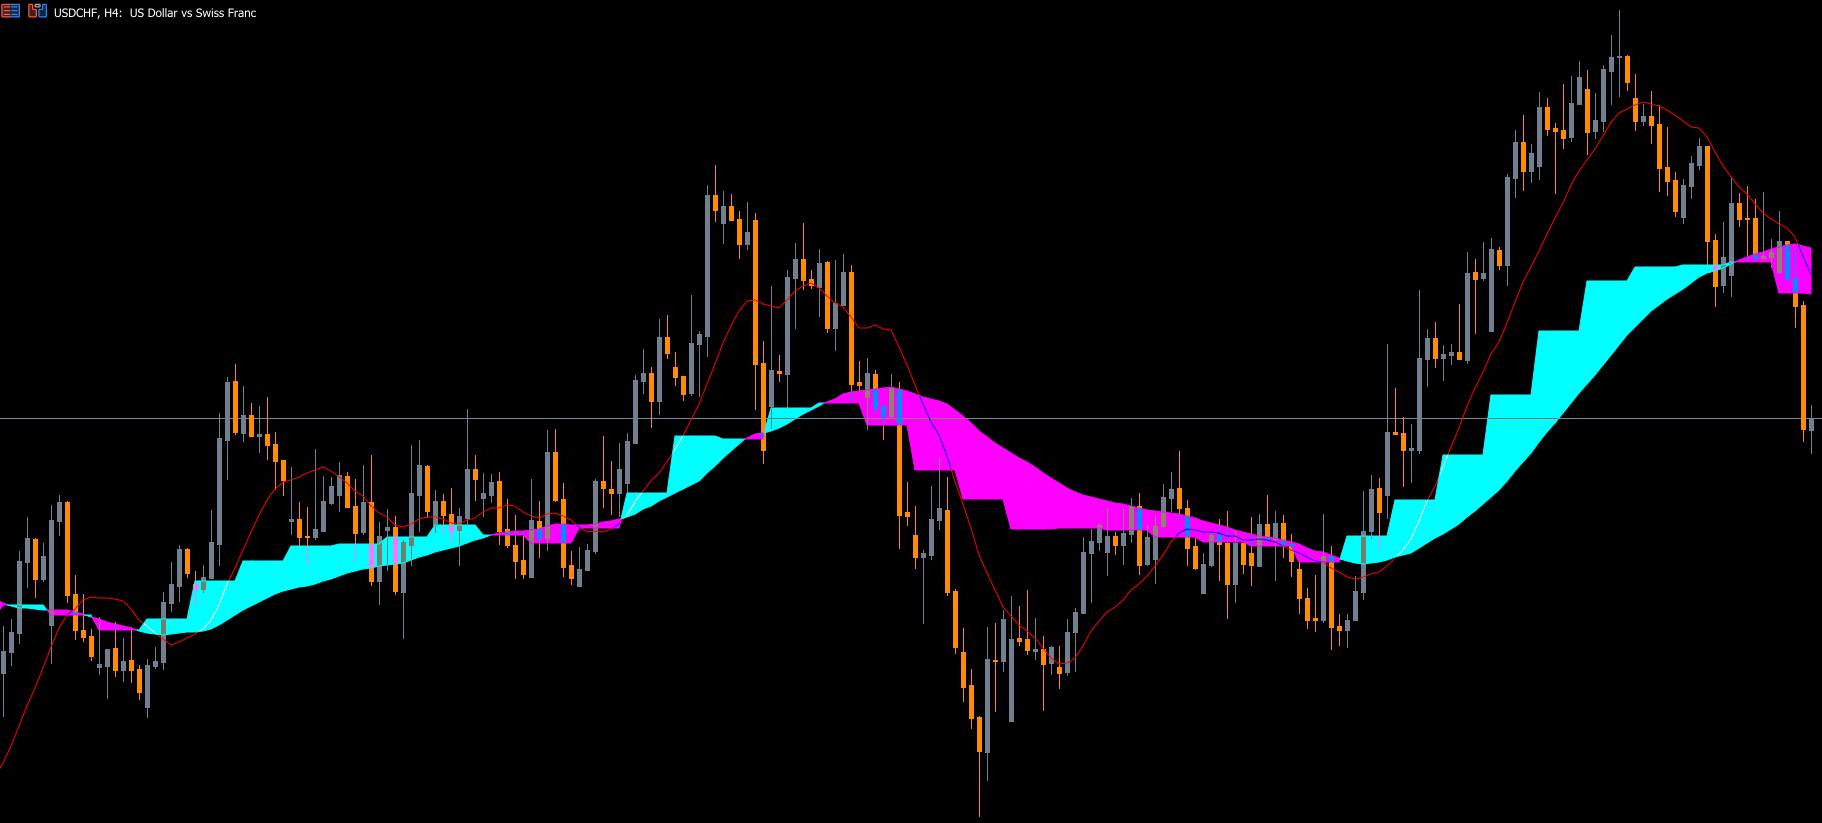
The indicator displays colored “clouds” to illustrate bullish and bearish trends:
Aqua Cloud → Indicates a bullish trend.
Purple Cloud → Indicates a bearish trend.
These visual clouds simplify market analysis by showing where the price is trending, and when it might be reversing.
When the aqua cloud appears, it signals bullish momentum — suggesting an opportunity to enter a buy trade. Traders can place a stop loss below the previous swing low and ride the trend until an opposite (purple) signal forms.
When the purple cloud appears, it signals bearish momentum — a good time to enter a sell trade. The stop loss should be placed above the most recent swing high, and profits can be locked in once the indicator shifts back to bullish.
By following these simple visual signals, traders can stay aligned with market direction and avoid overcomplicated chart analysis.
MTF (Multi-Timeframe) Strategy
The Real Cloud Indicator’s ability to mix moving averages from multiple timeframes allows traders to design custom MTF strategies. For instance:
Use the 76-period MA on a higher timeframe (H4 or Daily) to confirm the main trend.
Use the 9-period MA on the current timeframe (M15 or H1) to time precise entries.
This combination helps identify trend continuation or reversal setups earlier, giving traders an advantage in both short-term and long-term trading environments.
Key Features and Benefits
Dual Moving Average Cloud System – Combines fast and slow MAs for trend clarity.
Visual Trend Identification – Aqua and purple clouds make it easy to spot trends.
Entry & Exit Signals – Works as a complete standalone trading strategy.
Fully Customizable – Modify MA periods and timeframes for flexibility.
Works on All Assets – Forex, indices, metals, and crypto markets.
Suitable for All Levels – Simple enough for beginners, powerful for pros.
Best Practices for Using the Real Cloud Indicator
Use the aqua cloud for buy trades and purple cloud for sell trades.
Follow the trend rather than trying to predict reversals.
Always confirm with additional tools like RSI, MACD, or volume filters for stronger validation.
Adjust stop loss dynamically using the base of the cloud to protect profits as the trend continues.
Conclusion
The Real Cloud Indicator for MT5 is a simple yet powerful trend-following system built on moving average crossovers. Its colored cloud zones make identifying bullish and bearish trends effortless. Because it can generate both entry and exit signals, traders can use it as a standalone system without relying on multiple indicators.
Whether you’re Scalping on lower timeframes or holding swing trades on daily charts, the Real Cloud Indicator provides consistent, clear, and adaptive trend insights. Test it on a demo account first, then integrate it into your main trading setup to experience smoother and more confident trading decisions.
FAQ
3 Downloads
Published:
Nov 11, 2025 10:57 AM
Category: