Understanding Market Exhaustion with the I-Day DeMarker Indicator
In the pursuit of high-probability trading setups, timing is everything. Entering a trend too late or missing a reversal can be the difference between a winning session and a significant drawdown. The I-Day DeMarker Indicator for MetaTrader 4 is a specialized technical tool designed to identify these critical turning points by measuring the demand for an underlying asset relative to its Price Action over a specific period.
What is the I-Day DeMarker Indicator?
Originally developed by legendary technical analyst Tom DeMark, the DeMarker (or DeM) indicator is an oscillator that compares the most recent maximum and minimum prices to the previous period's equivalent prices. The "I-Day" variation is optimized for intraday price action, providing a smoothed, low-lag oscillator that fluctuates between values of 0 and 1.
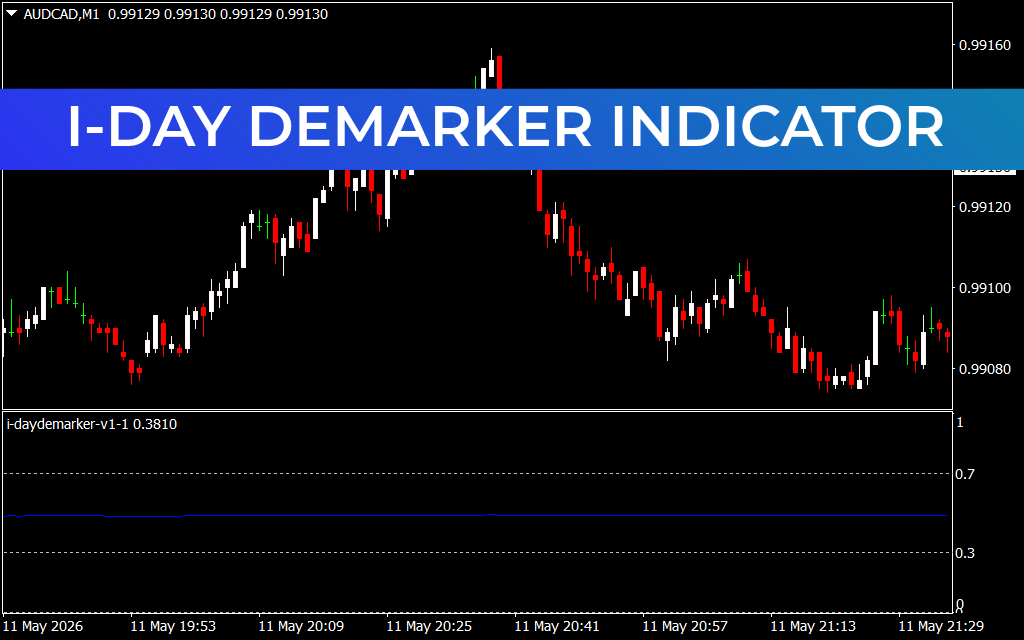
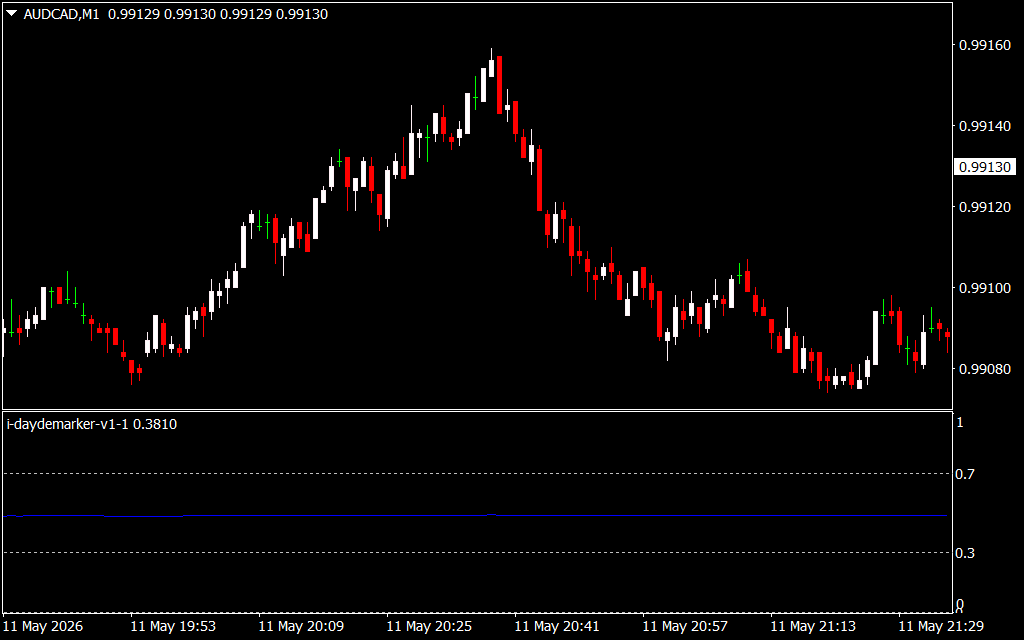
As seen in the AUD/CAD M1 chart, the indicator appears in a separate sub-window, featuring a signal line that traverses three key zones:
- The Overbought Zone (0.7 to 1.0): Indicates that buying pressure may be reaching a point of exhaustion.
- The Neutral Zone (0.3 to 0.7): Suggests a balanced market or a steady trend.
- The Oversold Zone (0.0 to 0.3): Signals that selling pressure is likely overextended.
The Science Behind the Signals
Unlike standard oscillators like the Relative Strength Index (RSI), which focus solely on closing prices, the I-Day DeMarker places a heavy emphasis on intra-period highs and lows. This nuance allows it to catch price exhaustion before it is reflected in the close, giving intraday traders a vital "head start."
When the signal line enters the extreme zones (above 0.7 or below 0.3), it does not necessarily mean a reversal is imminent, but rather that the risk of a reversal has increased. Professional traders look for the signal line to exit these zones as a confirmation that the momentum has shifted. For instance, if the line climbs above 0.7 and then crosses back below it, it creates a high-conviction "sell" signal.
Strategic Implementation in Day Trading
The I-Day DeMarker is exceptionally versatile, but it shines brightest when used as a confluence tool:
- Divergence Trading: One of the most powerful ways to use this indicator is by spotting divergences. If the price makes a "higher high" but the I-Day DeMarker makes a "lower high," it is a classic warning of a weakening trend.
- Trend Confirmation: During a strong uptrend, the indicator will often stay in the upper half of the range. Traders can use dips toward the 0.5 or 0.3 levels as "buy the dip" opportunities within a broader bullish context.
- Scalping Filters: For 1-minute or 5-minute scalpers, the I-Day DeMarker acts as a final filter. By avoiding "buys" when the indicator is above 0.7, traders can significantly reduce the number of "bull trap" entries.
By integrating the I-Day DeMarker into your MT4 toolkit, you gain a mathematically objective view of market sentiment, allowing you to trade with the precision required in today's fast-moving financial markets.g with greater confidence.
1 Download
Last Update:
May 12, 2026 03:20 AM
Published:
Jan 24, 2026 12:54 PM
Category: