Precision Trend Analysis: The RVI LSMA Version for MT4 and MT5
In the quest for the ultimate Momentum Indicator, traders often find themselves choosing between sensitivity and smoothness. Standard oscillators are often too "noisy," providing false signals during minor price fluctuations, while traditional moving averages can be too lagging. The RVI LSMA Version is a hybrid technical tool that bridges this gap by combining the Relative Vigor Index (RVI) with a Least Squares Moving Average (LSMA) filter.
Understanding the RVI and LSMA Synergy
The Relative Vigor Index (RVI) is based on the theory that in a bullish market, the closing price is generally higher than the opening price. By measuring this energy, RVI identifies the conviction behind a trend. However, raw RVI data can be jagged.
The addition of the LSMA (Least Squares Moving Average)—also known as an End-Point Moving Average—calculates a least-squares regression line for the preceding periods. This essentially predicts where the price "should" be if the current trend continues. When applied to the RVI, the LSMA acts as a powerful smoothing mechanism that reduces lag significantly compared to a standard SMA or EMA.
Key Features of the RVI LSMA Version
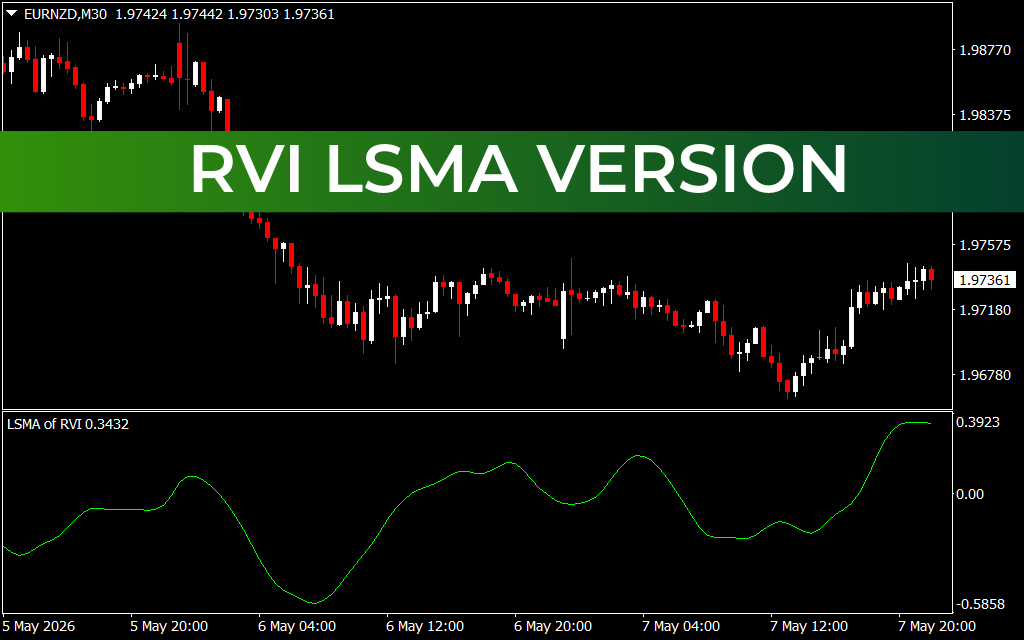
As seen in the EURNZD M30 chart, the indicator appears as a clean, oscillating green line in a sub-window. Its primary strengths include:
- Superior Smoothing: Unlike standard oscillators that flicker between positive and negative values, the LSMA version provides a fluid curve. This allows traders to stay in a trend without being shaken out by "market noise."
- Zero-Line Cross Clarity: The zero-point acts as the pivot for market sentiment. When the green line crosses above zero, it confirms bullish vigor; a cross below zero signals a transition into a bearish regime.
- Trend Exhaustion Signals: The peaks and troughs of the LSMA-filtered RVI are much more distinct. When the line begins to flatten or curl back toward the zero-line at extreme levels, it provides an early warning of potential trend exhaustion.
Strategic Application: Finding the Edge
The RVI LSMA Version is particularly effective for Swing Traders and Trend Followers. In the provided M30 example, notice how the indicator transitioned from a deep negative valley to a steady climb above the zero-line as the EURNZD price began its recovery on May 7th.
A high-probability strategy involves using the zero-line cross as a confirmation of a Price Action breakout. If price breaks above a resistance level and the RVI LSMA line is simultaneously rising through zero, the "vigor" of the move is confirmed by mathematical regression.
Furthermore, it serves as a brilliant filter for Divergence Trading. If price makes a new high but the smoothed RVI line makes a lower high, it indicates that the internal momentum is fading despite the higher price—a classic signal to tighten stop-losses or look for a reversal.
Conclusion
The RVI LSMA Version for MetaTrader is a refined evolution of a classic momentum tool. By applying regression-based smoothing to vigor analysis, it provides a "cleaner" look at market dynamics. For traders who demand precision and want to eliminate the anxiety of "choppy" signals, this indicator offers the mathematical clarity required to trade with professional-grade confidence.
2 Downloads
Last Update:
May 08, 2026 01:19 AM
Published:
Jan 26, 2026 14:47 PM
Category: