Master Market Momentum with the Relative Strength Index RSI Indicator
In the highly competitive world of Forex trading, chasing overextended price trends is a common pitfall that often leads to severe drawdowns. To navigate volatile currency swings successfully, professional technical analysis relies on identifying structural exhaustion points. The Relative Strength Index RSI is universally recognized as one of the most reliable and time-tested momentum oscillators ever developed. By measuring the speed and change of price movements, this powerful tool mathematical quantifies market velocity, showing you exactly when an asset is ripe for a reversal.
Operating within a clean sub-window beneath your core Price Action, the RSI indicator provides day traders, swing traders, and scalpers with an unshakeable objective framework.
Decoding the Mechanics of Overbought and Oversold Zones
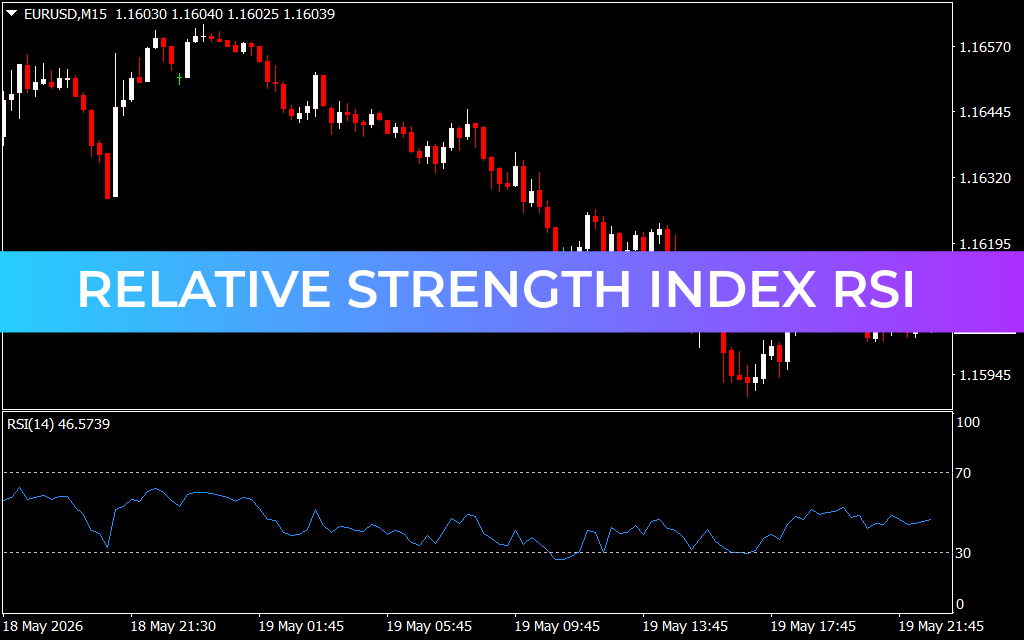
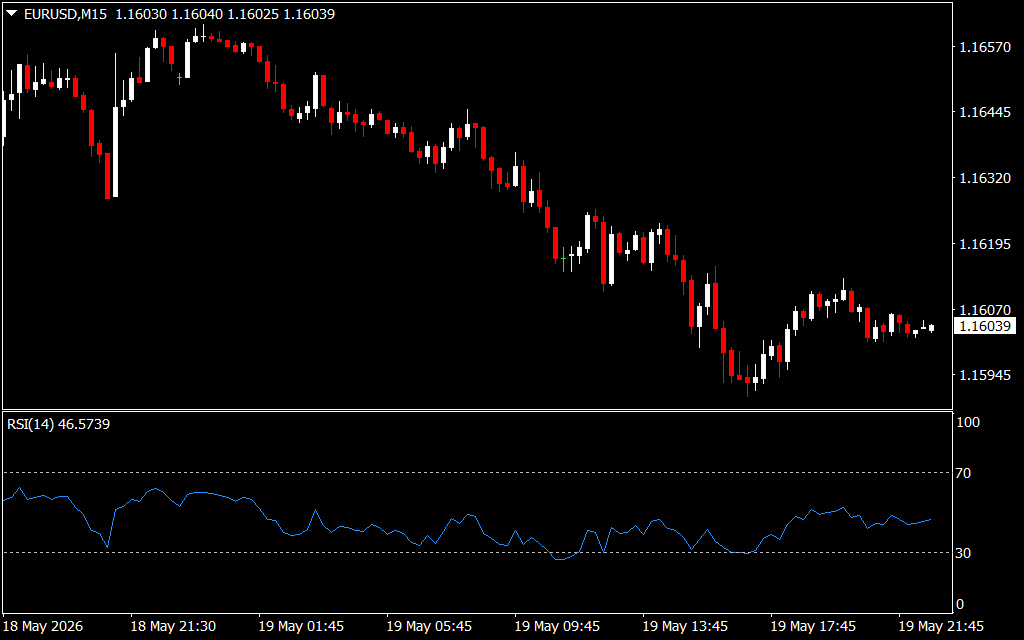
When analyzing financial charts, such as liquid major pairs on a 15-minute ($M15$) interval, it is easy to get caught up in emotional market noise. The Relative Strength Index strips away structural confusion by normalizing price velocity onto a fixed scale from 0 to 100.
As shown in standard platform configurations like the classic RSI(14), the indicator maps a dynamic signal line against two critical psychological thresholds:
- The Overbought Boundary (Level 70): When the RSI line climbs above the 70.00 threshold, it signals that buying pressure has reached a mathematical extreme. This warns technical analysts that the current upward trend is overextended and a downward correction or consolidation phase is highly probable.
- The Oversold Boundary (Level 30): Conversely, when severe distribution pushes the blue RSI line beneath the 30.00 baseline, it highlights an exhausted selling environment. This indicates that institutional supply is drying up, offering an early warning that a bullish bounce is on the horizon.
Executing Advanced Trading Strategies with RSI Confluence
The real power of the Relative Strength Index RSI indicator surfaces when it is integrated into a rule-based execution system rather than treated as a simple standalone trigger.
1. Spotting Structural Divergence
One of the most potent setups in technical analysis is RSI divergence. If the raw price on your candlestick chart makes a distinct higher high, but the corresponding RSI signal line prints a lower high, a structural divergence occurs. This phenomenon reveals that beneath the surface, buying volume is rapidly decaying—giving sharp traders an incredibly early signal to prepare for a macro Trend Reversal.
2. Mastering Central 50-Line Trend Filters
The median 50.00 line acts as the ultimate multi-timeframe trend filter. When the market is in a sustained bullish cycle, the RSI line will consistently bounce off the 50 level during minor price pullbacks, validating healthy Trend Continuation. A decisive cross below the 50 line confirms that immediate market control has shifted back to the bears.
Conclusion
The Relative Strength Index RSI indicator remains an indispensable cornerstone of high-probability trading. By transforming raw price velocity into actionable overbought and oversold metrics, it prevents you from entering high-risk, late-stage trends. Download the RSI indicator today to optimize your MetaTrader workspace and trade with rule-based confidence.
2 Downloads
Last Update:
May 20, 2026 01:52 AM
Published:
Jan 19, 2026 11:26 AM
Category: