The I Day of Week Indicator MT4 is a practical and informative forex analysis tool designed to help traders understand how price behaves on specific days of the week. Many financial markets exhibit recurring weekly patterns due to institutional activity, economic news cycles, and trader psychology. This indicator makes it easier to visualize and exploit those patterns directly on the MetaTrader 4 platform.
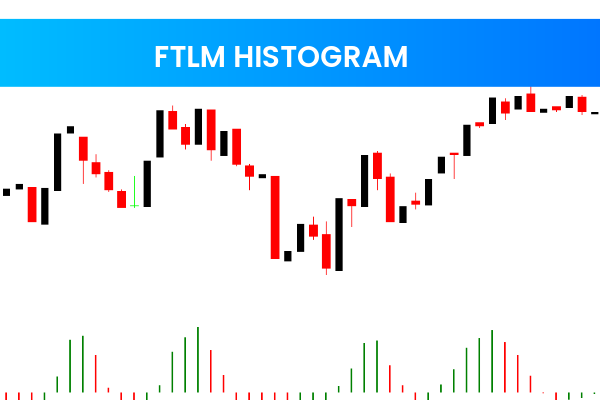
By using the I Day of Week Indicator MT4, traders can analyze historical price movements and identify which days are more bullish, bearish, or volatile for a specific currency pair. The indicator displays a color-coded histogram that represents the frequency and strength of price movements across each weekday, allowing traders to plan entries and exits more strategically.
This indicator is ideal for beginners and experienced traders alike. It does not repaint, requires minimal resources, and works smoothly on all MT4-compatible charts.
How the I Day of Week Indicator Works
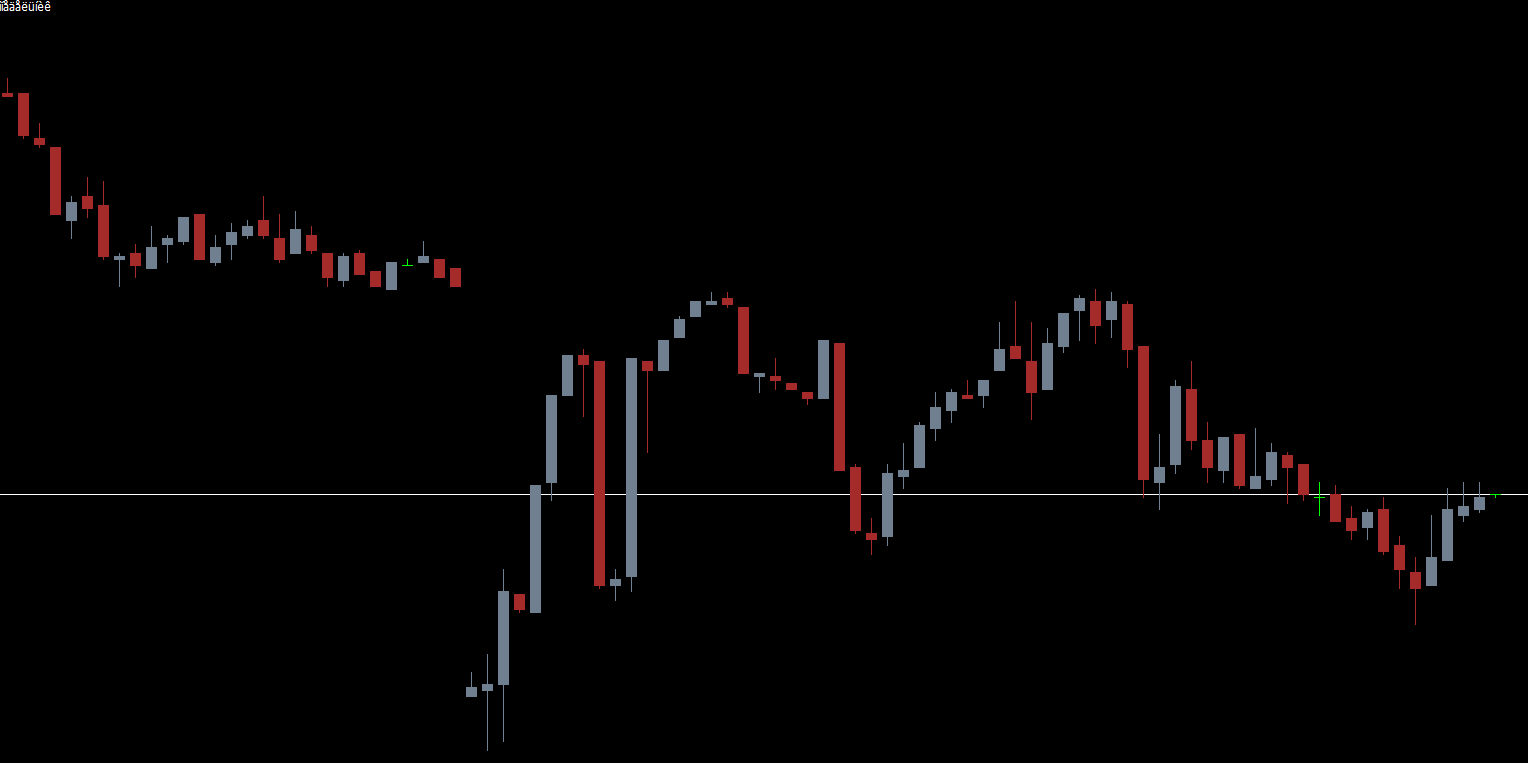
The I Day of Week Indicator MT4 analyzes historical price data and groups market behavior based on weekdays (Monday through Friday). It then plots a histogram showing how often bullish or bearish price movements occur on each day.
Each bar is color-coded to represent:
Strong bullish activity
Strong bearish activity
Neutral or mixed market behavior
This visual representation helps traders quickly determine which days historically favor buying or selling opportunities for a specific instrument.
Benefits of Using the I Day of Week Indicator MT4
The indicator offers several advantages for forex traders:
Identifies recurring weekly market patterns
Helps traders avoid low-probability trading days
Improves trade timing and session planning
Enhances confidence in directional bias
Works on all currency pairs and timeframes
Because it is based on statistical observation rather than prediction, it works best as a confirmation tool alongside other technical indicators.
How to Use the I Day of Week Indicator in Trading
Trend Bias Confirmation
Traders can use the indicator to confirm directional bias. For example:
If Tuesday consistently shows bullish movement on EUR/USD, traders may favor buy setups on that day.
If Friday often shows bearish pressure, traders may avoid long trades or look for sell opportunities.
Trade Filtering Strategy
The I Day of Week Indicator MT4 does not generate direct buy or sell signals. Instead, it helps traders filter trades by avoiding days with historically poor performance and focusing on high-probability days.
For best results, combine it with:
Trend indicators (Moving Averages, SuperTrend)
Momentum oscillators (RSI, MACD)
Support And Resistance levels
Trading Example
On a GBP/USD H1 chart, the indicator may show strong bullish activity on Wednesdays over several weeks. When price approaches a support level on Wednesday and confirms bullish Price Action, traders can confidently look for long entries with higher probability.
Similarly, if Mondays consistently show low volatility or mixed movement, traders can reduce risk by staying out of the market or using smaller position sizes.
Who Should Use the I Day of Week Indicator
This indicator is especially useful for:
Day traders planning weekly strategies
Scalpers avoiding low-volatility days
Swing traders timing entries with weekly bias
Forex traders analyzing behavioral patterns
It is a valuable addition to any trading system that emphasizes probability and consistency.
Conclusion
The I Day of Week Indicator MT4 is a powerful statistical analysis tool that helps traders understand how the market behaves on different weekdays. By identifying recurring price patterns, it allows traders to plan trades more efficiently, reduce unnecessary risk, and improve overall strategy performance.
Visit IndicatorForest.com today to download the I Day of Week Indicator MT4 for free and explore a wide range of professional forex indicators to enhance your trading edge.
FAQ
The I Day of Week Indicator MT4 analyzes historical price data and groups market behavior based on weekdays (Monday through Friday), plotting a histogram showing how often bullish or bearish price movements occur on each day. This helps traders understand how price behaves on specific days of the week due to institutional activity, economic news cycles, and trader psychology.
Each bar is color-coded to represent strong bullish activity, strong bearish activity, or neutral/mixed market behavior. This visual representation helps traders quickly determine which days historically favor buying or selling opportunities for a specific instrument, allowing strategic planning of entries and exits.
Traders can use the indicator to confirm directional bias. For example, if Tuesday consistently shows bullish movement on EUR/USD, traders may favor buy setups on that day. If Friday often shows bearish pressure, traders may avoid long trades or look for sell opportunities. The indicator helps filter trades by avoiding days with historically poor performance.
No, the I Day of Week Indicator MT4 does not generate direct buy or sell signals. Instead, it helps traders filter trades by avoiding days with historically poor performance and focusing on high-probability days. It works best as a confirmation tool alongside other technical indicators such as trend indicators, momentum oscillators, or support/resistance levels.
This indicator is especially useful for day traders planning weekly strategies, scalpers avoiding low-volatility days, swing traders timing entries with weekly bias, and Forex traders analyzing behavioral patterns. It is a valuable addition to any trading system that emphasizes probability and consistency.
Published:
Dec 15, 2025 22:35 PM
Category: