Precision Range Trading with the I HighLow Indicator for MT5
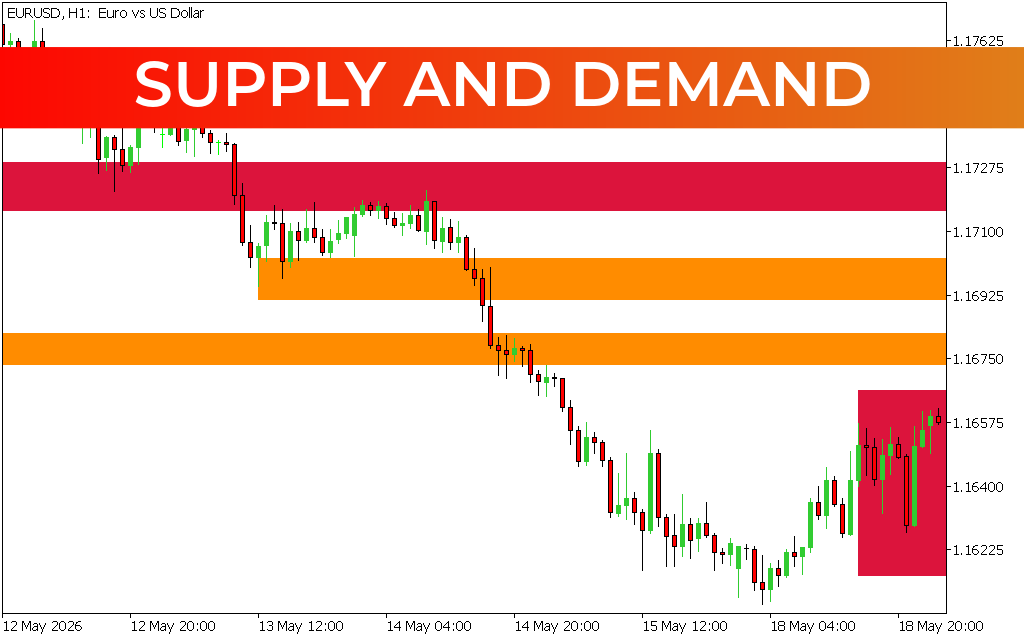
In the modern trading landscape, institutional players move the market between key levels of liquidity. Identifying these "highs" and "lows" is the foundation of almost every successful trading strategy, from simple Support And Resistance to complex market structure analysis. The I HighLow Indicator for MT5 is a high-performance technical tool designed to capture these critical price boundaries in real-time, providing traders with a clear visual map of the market's range.
Understanding Price Extremes
Most retail traders struggle because they enter trades in the "middle" of a range, where Price Action is often random and unpredictable. The I HighLow Indicator solves this by plotting dynamic bands that represent the current market extremes. By focusing on the outer edges of price movement, traders can identify high-probability reversal points or confirm powerful breakout momentum.
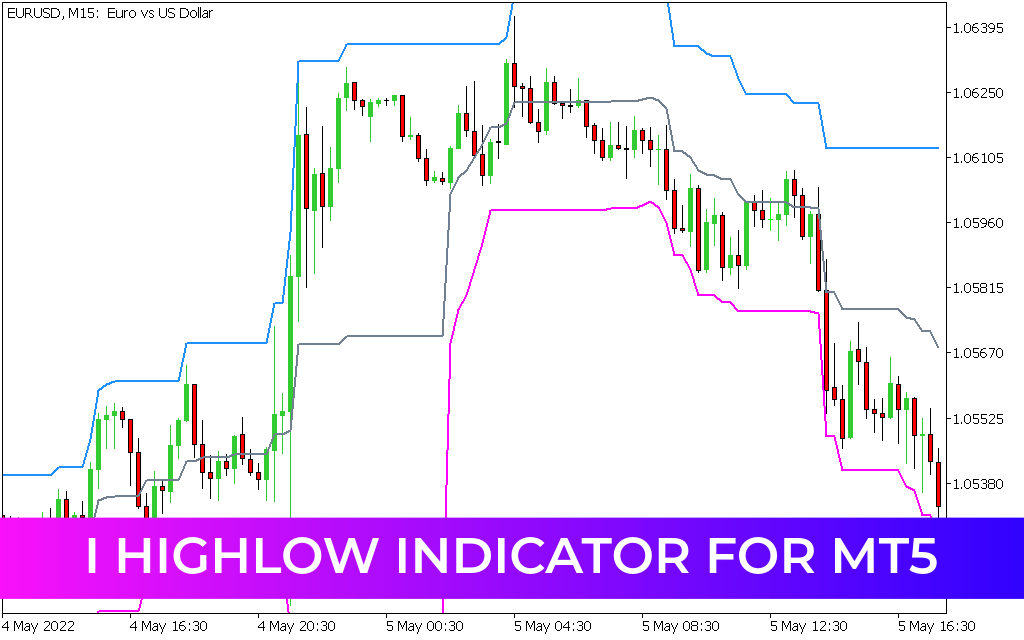
As illustrated in the EUR/USD M15 chart, the indicator uses a three-band system:
- The Upper Blue Band: Represents the peak resistance level over a specified period.
- The Lower Magenta Band: Highlights the floor of the current market range.
- The Median Gray Line: Acts as a dynamic baseline, helping traders identify the "fair value" or equilibrium of the pair.
Strategic Versatility for Every Trader
The beauty of the I HighLow Indicator lies in its adaptability across various trading styles. Whether you are a scalper, day trader, or swing trader, this MT5 utility provides the structural context needed to make informed decisions.
- For Mean Reversion Traders: When price touches the blue or magenta bands without breaking through, it often signals a "stretched" market ready to return to the median gray line. This allows for high-reward contrarian entries.
- For Breakout Specialists: A decisive candle close above the blue high or below the magenta low indicates a shift in market sentiment. These "breaks in structure" are often the start of significant new trends, as seen in the sharp bearish descent on the right side of the example chart.
- For Risk Management: The bands provide objective levels for placing stop-losses. By placing a stop just beyond the recent High or Low, you ensure your trade is protected by a mathematically significant barrier.
Optimized for MetaTrader 5
The I HighLow Indicator is built specifically for the MT5 platform, taking advantage of its superior processing speed and multi-threaded architecture. It runs smoothly without lagging your terminal, even on lower timeframes like the M1 or M5 where price updates are frequent. The indicator is fully customizable, allowing you to adjust the "period" to match your specific timeframe and trading frequency.
Stop trading blindly into resistance or selling into support. By adding the I HighLow Indicator to your MetaTrader 5 toolkit, you gain a professional-grade visual aid that turns chaotic price action into a structured, tradable map.
1 Download
Last Update:
May 12, 2026 20:28 PM
Published:
Jan 23, 2026 12:19 PM
Category: