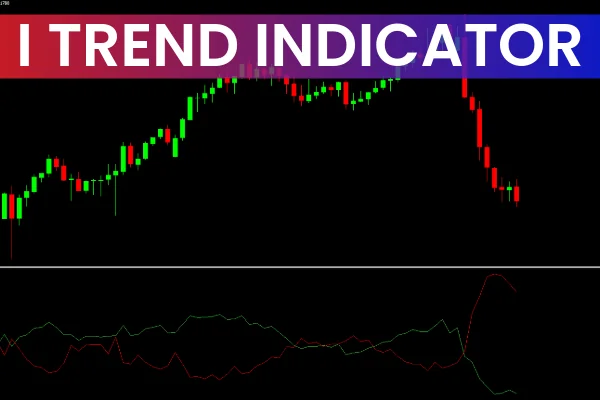
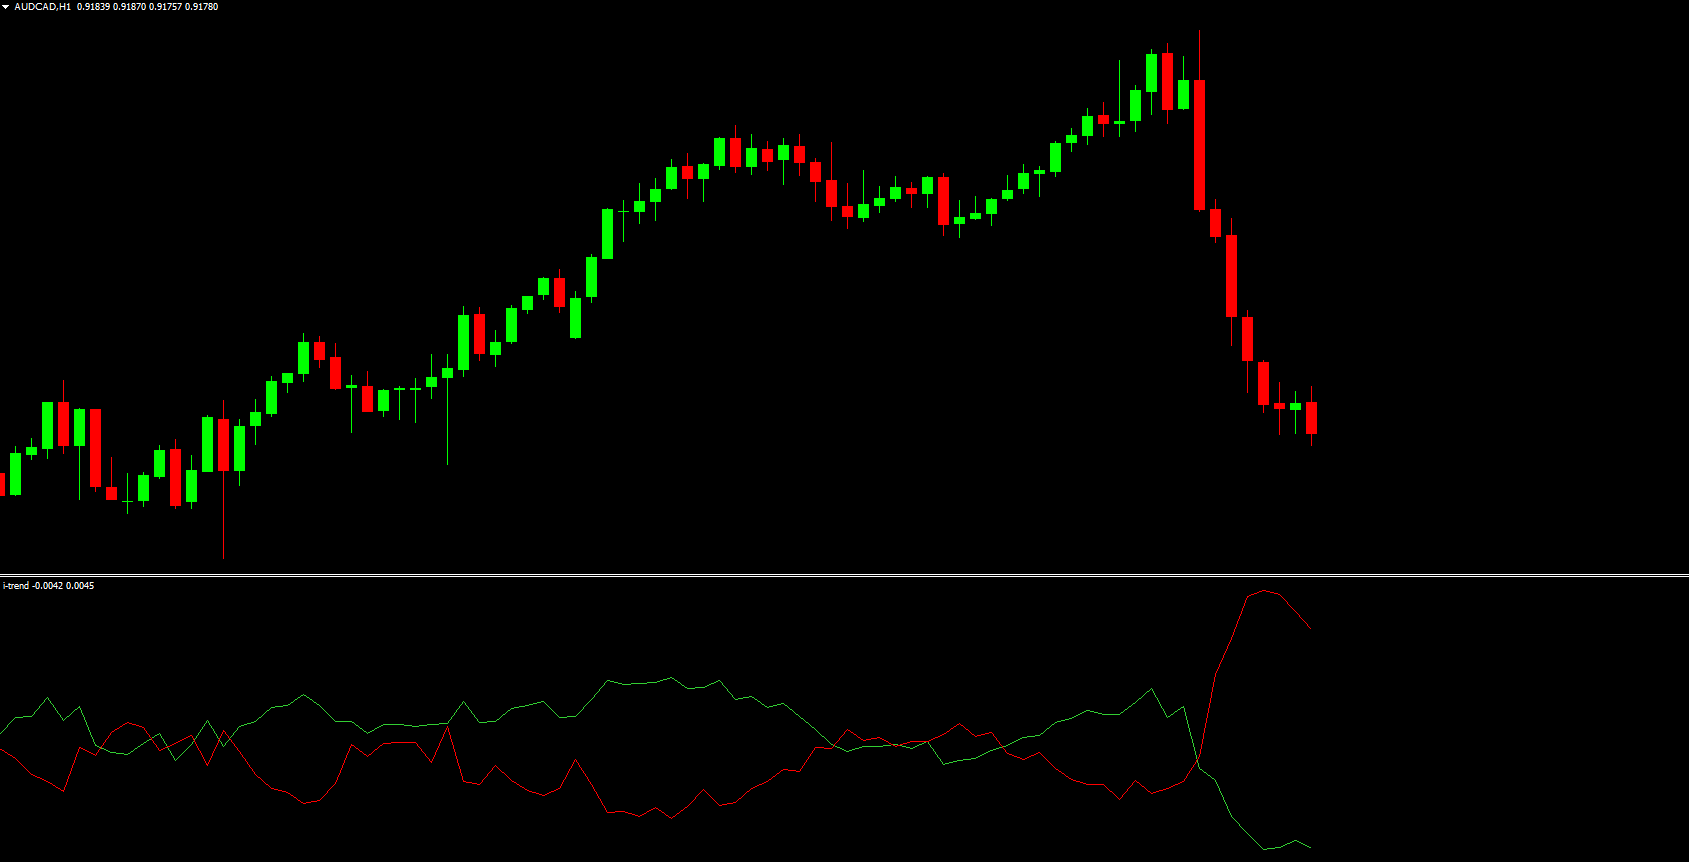
The i Trend Indicator for MT4 is a technical analysis tool designed to help traders identify market trends and potential reversal points. Using a combination of moving averages and Price Action analysis, it shows whether the market is in a bullish or bearish phase. The indicator plots two lines on the chart: a green line representing buying pressure and a red line representing selling pressure.
This indicator is ideal for trend-following strategies, helping traders make informed decisions about entries and exits. It works effectively across multiple timeframes, making it suitable for intraday as well as longer-term trading strategies.
How the i Trend Indicator Works
Buy Signal – Triggered when the green line crosses above the red line, indicating that buying pressure is dominating. Traders can consider entering a buy position.
Sell Signal – Triggered when the red line crosses above the green line, signaling that selling pressure is stronger. Traders may consider entering a sell position.
Trend Strength – The gap between the green and red lines shows trend strength. A wider gap suggests a strong trend, while a narrowing gap signals potential weakening.
Advantages for Traders
Provides clear visual signals for trend direction
Works across multiple timeframes for flexibility in trading strategies
Helps assess market momentum and potential reversal points
Suitable for both novice and experienced traders
Conclusion
The i Trend Indicator for MT4 is a powerful yet easy-to-use tool for analyzing market trends and spotting entry points. By providing clear buy and sell signals along with trend strength insights, it helps traders make informed decisions based on market momentum. Its customizable settings make it adaptable to different trading styles, making it a valuable addition to any forex trader’s toolkit.
FAQ
3 Downloads
Published:
Dec 07, 2025 10:57 AM
Category: