The Ichimoku Trend Monitor Indicator is a powerful and reliable Forex Indicator designed for traders who want to monitor market trends across multiple timeframes from a single chart. Built on the well-known Ichimoku Kinko Hyo system, this indicator simplifies complex trend analysis and helps traders make confident, data-driven trading decisions.
Instead of manually switching between timeframes, the Ichimoku Trend Monitor automatically scans different periods and presents the overall trend direction in a clear, visual format.
What Is the Ichimoku Trend Monitor Indicator?
The Ichimoku Trend Monitor Indicator is a multi-timeframe trend dashboard that uses Ichimoku logic to analyze Price Action, trend bias, momentum, and support/resistance levels.
By consolidating this information into one panel, traders can instantly determine:
Whether the market is bullish, bearish, or ranging
How strong the trend is across different timeframes
Whether current price action aligns with higher-timeframe trends
This makes the indicator especially valuable for trend traders, swing traders, and intraday traders.
How the Ichimoku Trend Monitor Works
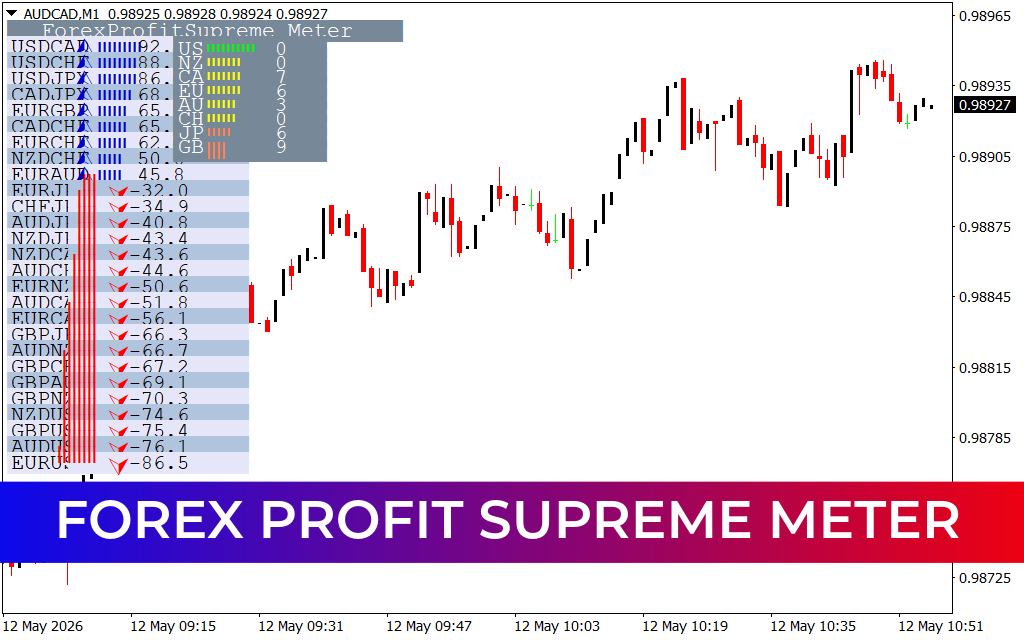
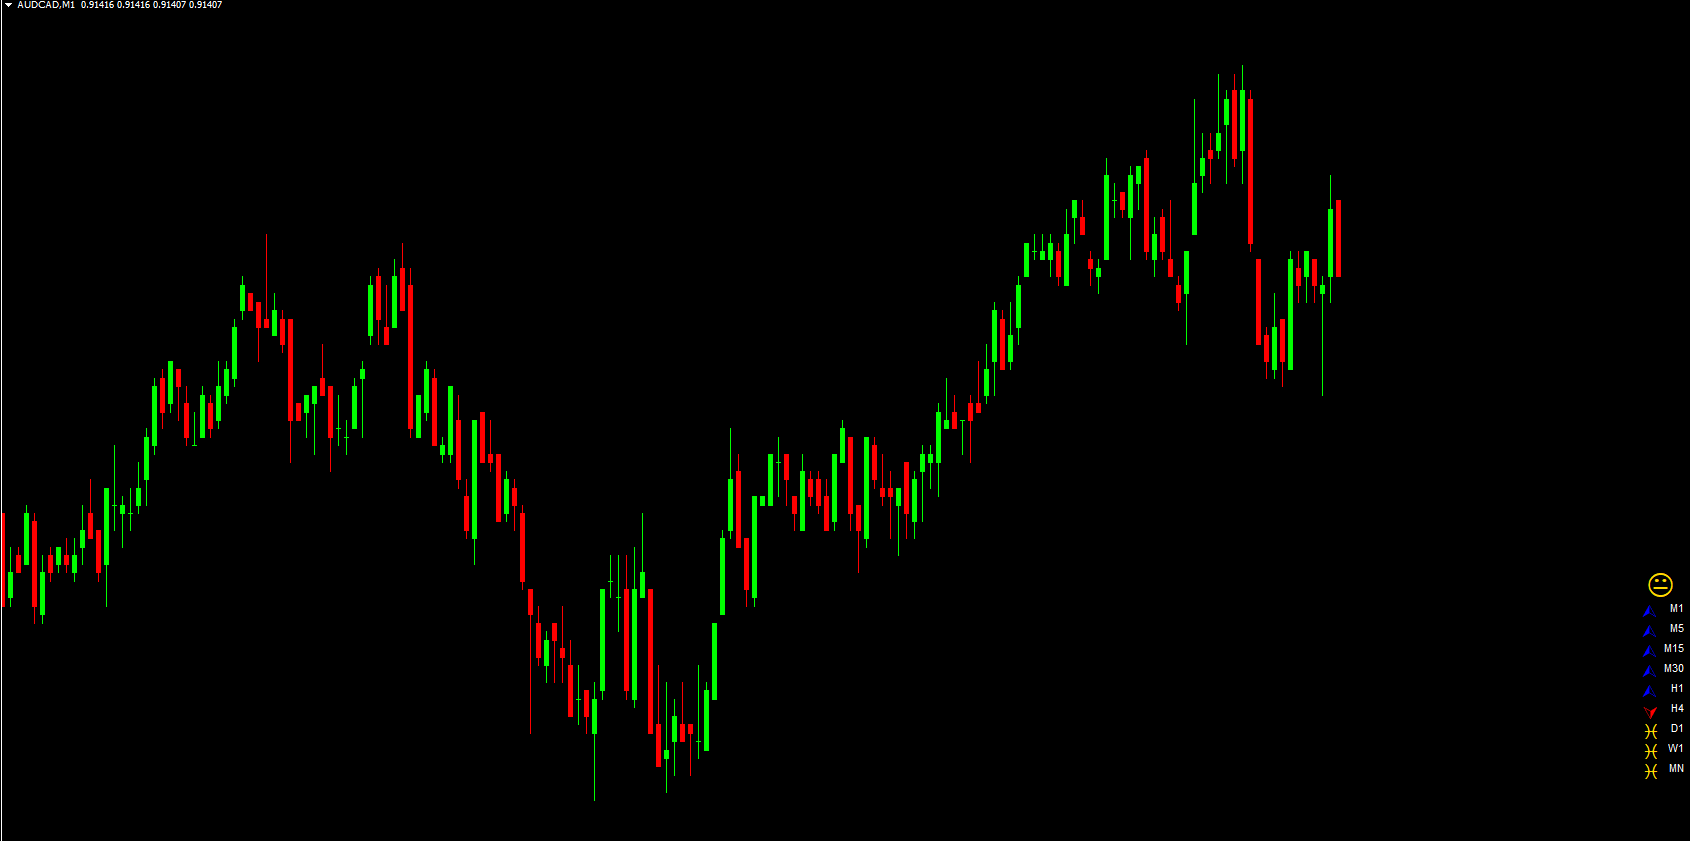
The indicator scans multiple timeframes using Ichimoku calculations and categorizes market conditions into three clear signals:
BLUE Arrow – BUY Signal → Bullish trend
RED Arrow – SELL Signal → Bearish trend
YELLOW Signal – No Trend → Sideways or unclear market
Each signal reflects the trend bias on its respective timeframe, allowing traders to quickly assess alignment across timeframes.
Important: Signals from higher timeframes are generally more reliable, as they carry greater influence over price movement.
Key Features of the Ichimoku Trend Monitor Indicator
Multi-Timeframe Trend Analysis
Scans several timeframes simultaneously and displays the results on one chart.
Clear Buy, Sell & No-Trend Signals
Color-coded arrows make trend direction easy to interpret.
Ichimoku-Based Logic
Uses Ichimoku Kinko Hyo principles to analyze trend, momentum, and price structure.
Support & Resistance Detection
Helps identify key price levels for entries, exits, and stop-loss placement.
Momentum & Trend Bias Insight
Provides a clear view of overall market direction and strength.
User-Friendly Interface
Suitable for both beginner and experienced Forex traders.
Benefits of Using the Ichimoku Trend Monitor Indicator
Faster Market Analysis
Eliminates the need to manually check multiple charts and timeframes.
Improved Trade Confidence
Aligning personal analysis with indicator signals increases decision-making confidence.
Higher-Probability Setups
Trading in the direction of higher-timeframe trends improves accuracy.
Better Risk Management
Identified Support And Resistance levels help define stop-loss and take-profit zones.
Versatile Trading Styles
Works well for Scalping, day trading, and swing trading.
How to Trade with the Ichimoku Trend Monitor Indicator
Trend-Following Strategy
Look for BLUE arrows on higher timeframes to confirm bullish bias
Enter buy trades on pullbacks using lower timeframes
Place stop-loss below key support levels
Bearish Market Strategy
Trade sell setups when RED arrows align across multiple timeframes
Use resistance zones for entries
Set take-profit near identified support levels
No-Trade Zones
Avoid trading when YELLOW signals dominate
Wait for a clear directional bias before entering the market
Risk Management with the Indicator
The Ichimoku Trend Monitor helps traders manage risk by:
Highlighting trend direction to avoid counter-trend trades
Identifying support and resistance for precise stop-loss placement
Encouraging alignment with higher-timeframe momentum
Using the indicator alongside proper position sizing and risk-reward rules can significantly improve long-term performance.
Why Choose the Ichimoku Trend Monitor Indicator?
The Ichimoku Trend Monitor Indicator is ideal for traders who want a clear, structured, and efficient approach to trend trading. By combining Ichimoku logic with multi-timeframe analysis, it removes guesswork and helps traders stay aligned with dominant market forces.
FAQ
1 Download
Published:
Dec 22, 2025 02:20 AM
Category: