Simplifying Multi-Timeframe Confluence: The Trend Alexcud Indicator MT4
Navigating localized intraday price shifts can confuse even seasoned retail traders, often causing them to mistake a minor retracement for a complete structural reversal. In fast-moving financial markets, achieving true statistical edge requires aligning short-term trade execution with dominant macro trends. The Trend Alexcud Indicator MT4 resolves this complexity. By condensing multiple data calculations and lookback periods into an elegant sub-window matrix, this technical analysis utility provides a reliable, mathematical snapshot of directional market state.
Here is an analytical breakdown of how this specialized multi-timeframe dashboard operates and how you can exploit its trend-filtering engine to protect your trading capital.
The Architecture of the Multi-Tiered Trend Grid
The core philosophy behind the Trend Alexcud architecture is structural alignment across key intervals. Instead of cluttering your primary candlestick chart with overlapping moving averages or lagging momentum lines, the algorithm processes Price Action behind the scenes. It continuously cross-references short-term velocity, mid-range swing levels, and macro-structural trends simultaneously.
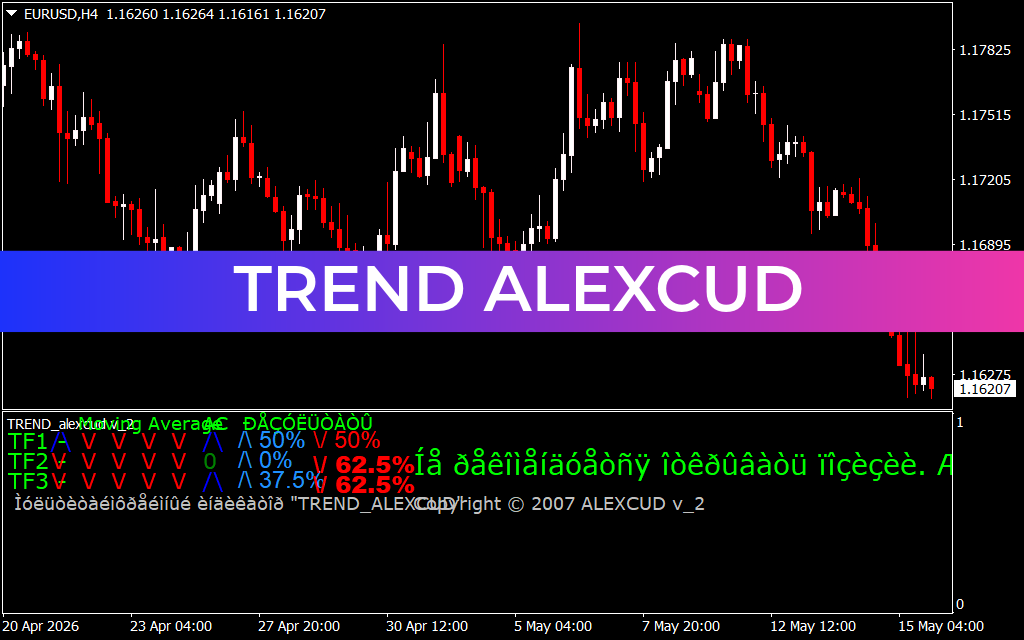
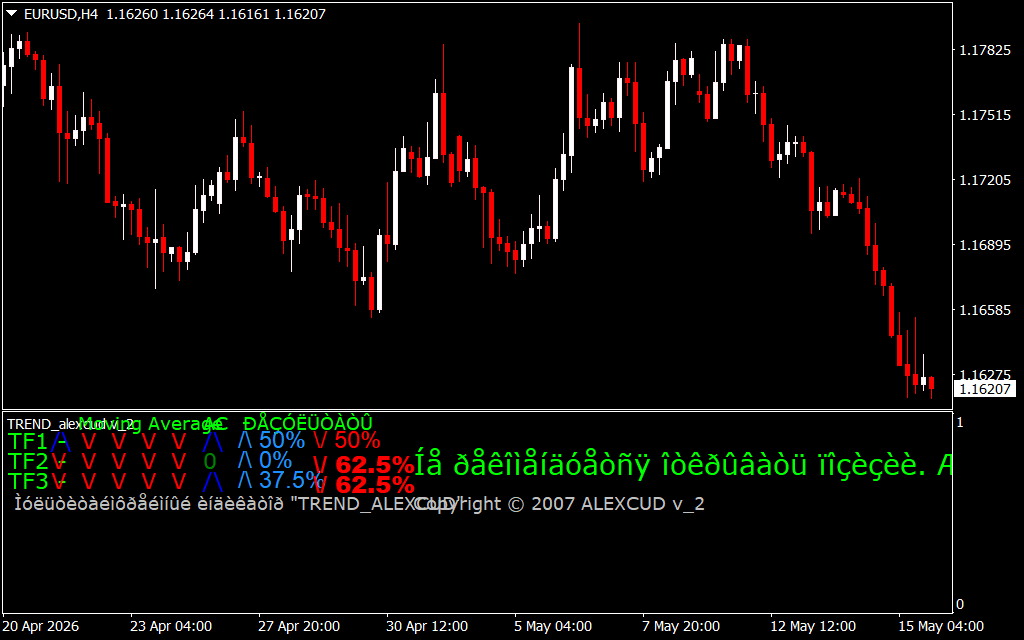
The results are displayed in a clean dashboard layout within an isolated sub-window. The system categorizes market states into three distinct trading filters ($TF1$, $TF2$, and $TF3$). This structural division allows day traders and swing traders to confirm instantly whether a localized breakout has authentic, high-volume support across the broader global market.
Deciphering the Color-Coded Execution Matrix
As demonstrated on the EUR/USD 4-hour chart setup, the indicator replaces standard lines with clear visual signals and percentage-based trend metrics:
- The Directional Logic Vectors ($\wedge$ and $\vee$): The dashboard prints upward blue carets ($\wedge$) to signify an established bullish trend, while downward red vectors ($\vee$) indicate a clear bearish liquidation phase.
- The Structural Hierarchy ($TF1$, $TF2$, $TF3$): These tracking tracks evaluate short, medium, and long-term momentum horizons. When all three levels display identical red symbols—as seen during the deep institutional markdown on the right side of the chart—it confirms a highly efficient, high-probability shorting environment.
- The Trend Strength Percentage Readout: Next to each tier, the indicator calculates mathematical ratios showing the balance between buyers and sellers (e.g., $50\%$ Buy vs. $50\%$ Sell, or a dominant $62.5\%$ Bearish bias). This text output ensures you never accidentally purchase an asset when institutional distribution is actively underway.
Strategic Guidelines for Professional Risk Management
To gain a clear trading edge using the Trend Alexcud indicator on your execution terminal, integrate these active management rules into your trading plan:
- Trade Exclusive Trend Confluence: Use the dashboard as a strict mathematical filter. Only execute entries when $TF1$, $TF2$, and $TF3$ show complete directional alignment. Entering a trade with mismatched timeframes often traps your position in sideways consolidation.
- Identifying Structural Turning Points: Watch for moments when the fast-reacting $TF1$ row transitions from a red down-vector to a blue up-vector. When supported by a rising strength percentage, this shift serves as an early warning that short-term short-covering is beginning, signaling you to tighten trailing stops.
- Filtering Flat Market Regimes: When the percentage metrics hover near an even equilibrium (like $50\% / 50\%$) and the symbols repeatedly flash back and forth, the market is in a choppy, non-trending state. Stand aside and wait for a clear institutional breakout to drive a decisive mathematical imbalance.
1 Download
Last Update:
May 17, 2026 02:41 AM
Published:
Jan 20, 2026 22:20 PM
Category: