Master the Markets with the Liquidity Trading Indicator
In modern financial markets, retail traders often find themselves on the wrong side of the move. This happens because traditional technical analysis frequently ignores where the real power lies: institutional liquidity. Smart money—banks, hedge funds, and institutions—requires massive pools of orders to enter and exit positions. The Liquidity Trading Indicator for MetaTrader is engineered to map these hidden institutional zones, giving retail traders the ability to trade alongside the market drivers rather than against them.
What is Liquidity Trading?
Liquidity trading is a strategy focused on identifying key price levels where a high volume of pending orders (stop-losses and buy/sell limits) are resting. Institutions actively drive prices toward these pools to fill their large orders, creating what is commonly known as a "liquidity sweep."
Once these orders are triggered, the market rapidly reverses, leaving retail breakout traders trapped. The Liquidity Trading Indicator automates the complex task of finding these structural levels, allowing you to anticipate sweeps and target high-probability reversal setups.
Key Features and Trading Advantages
- Institutional Zone Mapping: Automatically identifies major pools of liquidity, pinpointing exactly where smart money is likely to target.
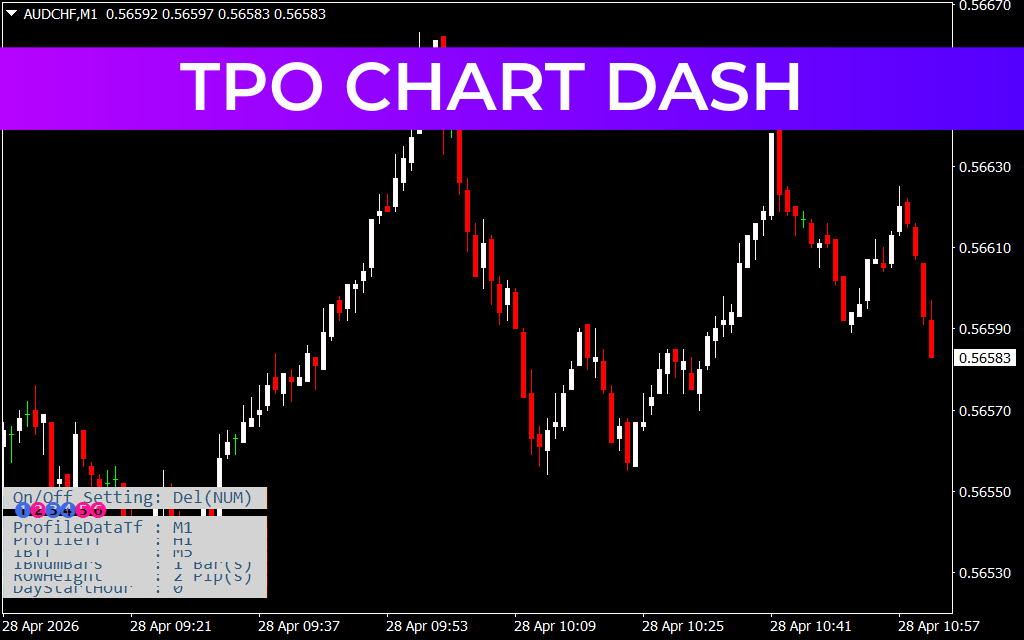
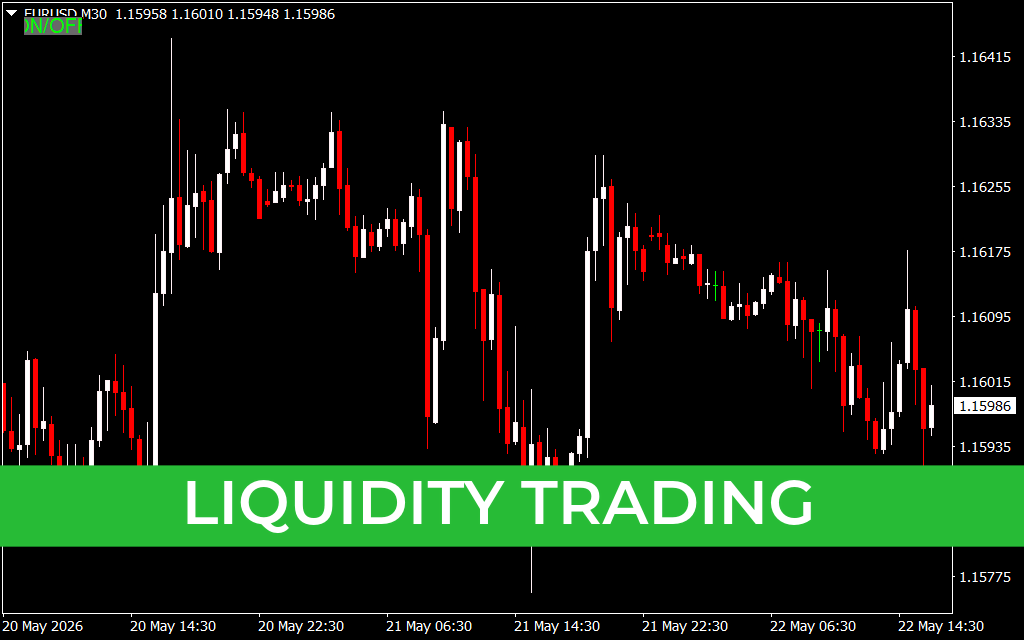
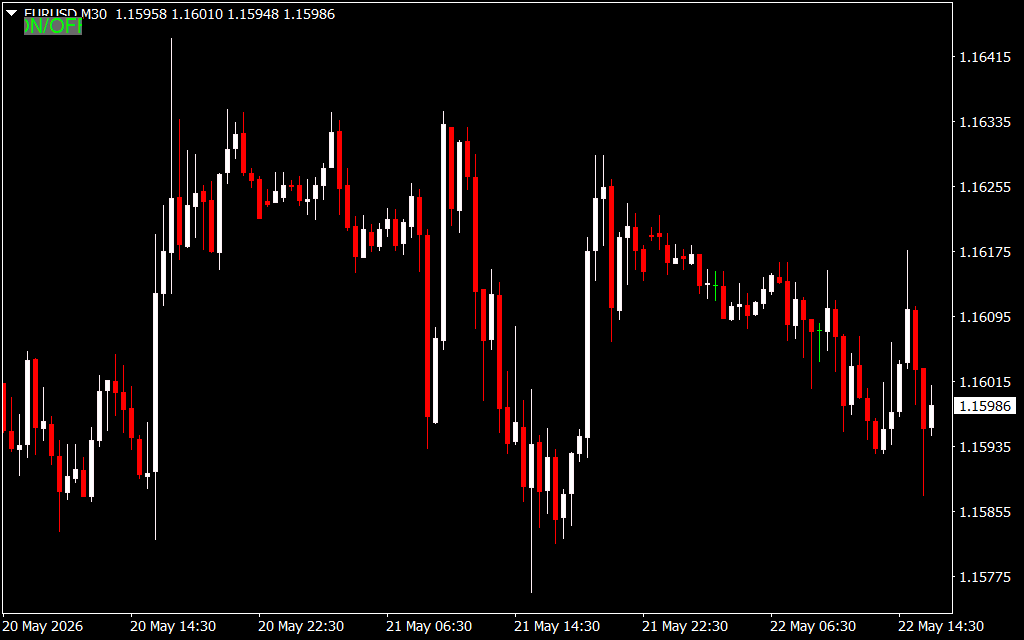
- On/Off Toggle Functionality: Features a clean, interactive "ON/OFF" utility button directly on the chart (as seen in the upper-left corner of the EURUSD M30 chart), allowing you to clear your screen instantly for uninterrupted Price Action analysis.
- Precision Timing for Reversals: Helps you avoid buying at the absolute top or selling at the very bottom by highlighting overextended market structures.
- Seamless Multi-Timeframe Application: Works efficiently across all timeframes, whether you are Scalping the M5 noise or swing trading the H4 macro trends.
How to Trade with the Liquidity Trading System
To build a robust trading strategy around market liquidity, combine the indicator's structural levels with clean price action confirmation:
- Identify the Target: Watch for price to approach a major historical high or low where retail stop-losses are heavily clustered.
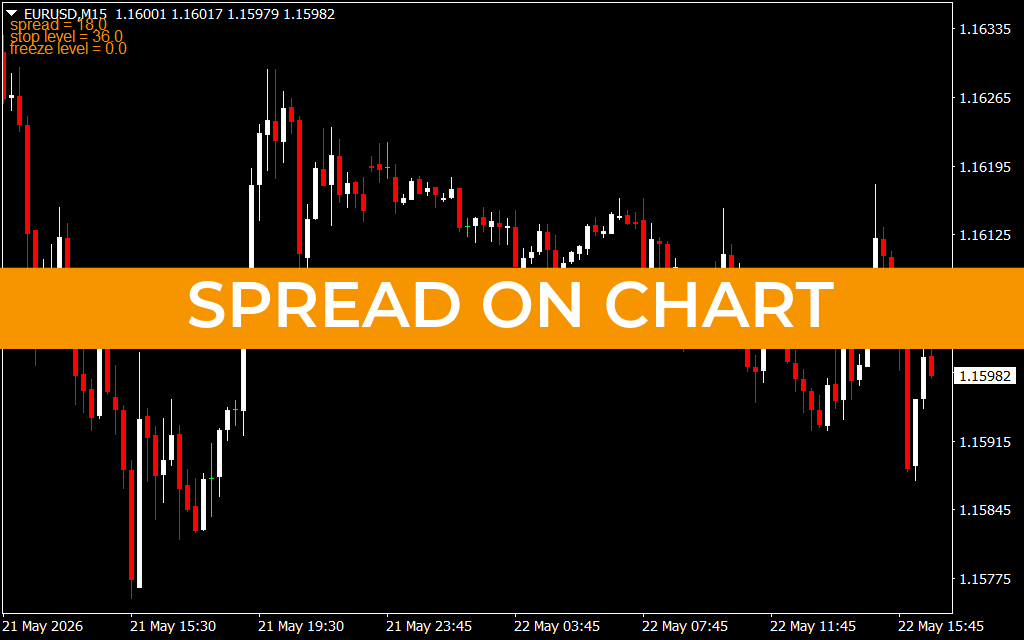
- Monitor the Sweep: Look for a sharp, aggressive candle that punctures the liquidity zone but fails to hold. On the M30 chart, these are often characterized by long candle wicks that reject extreme price levels (such as the sharp swing lows near the 1.15795 mark).
- Execute on Rejection: Once the indicator confirms the liquidity has been swept and price closes back within the structural range, execute a counter-trend position. Place your stop-loss safely just beyond the tip of the rejection wick.
By focusing on order flow and institutional behavior rather than lagging indicators, the Liquidity Trading tool transforms your chart from a chaotic guessing game into a clear map of market Supply And Demand.
3 Downloads
Last Update:
May 22, 2026 19:39 PM
Published:
Jan 17, 2026 19:04 PM
Category: