Mastering Price Targets with the IMA Fibs Above Indicator
In technical analysis, identifying where a trend might pause or reverse is a constant challenge. Standard moving averages tell you where the market has been, but they rarely tell you where it is going. The IMA Fibs Above indicator is a forward-looking technical tool designed to bridge this gap by projecting high-probability price targets using a blend of advanced smoothing and Fibonacci mathematical ratios.
What is the IMA Fibs Above?
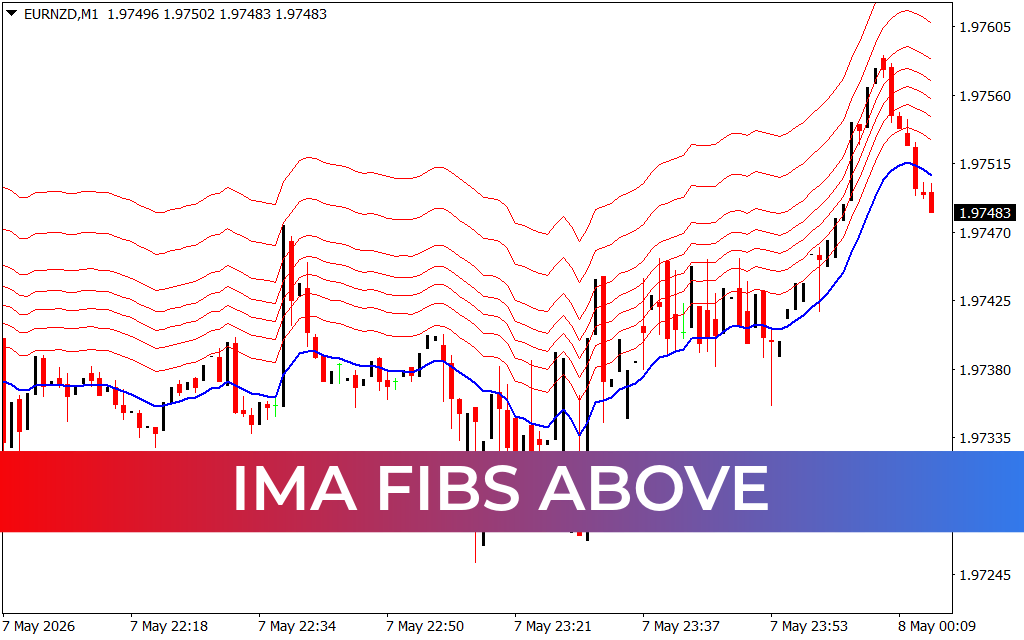
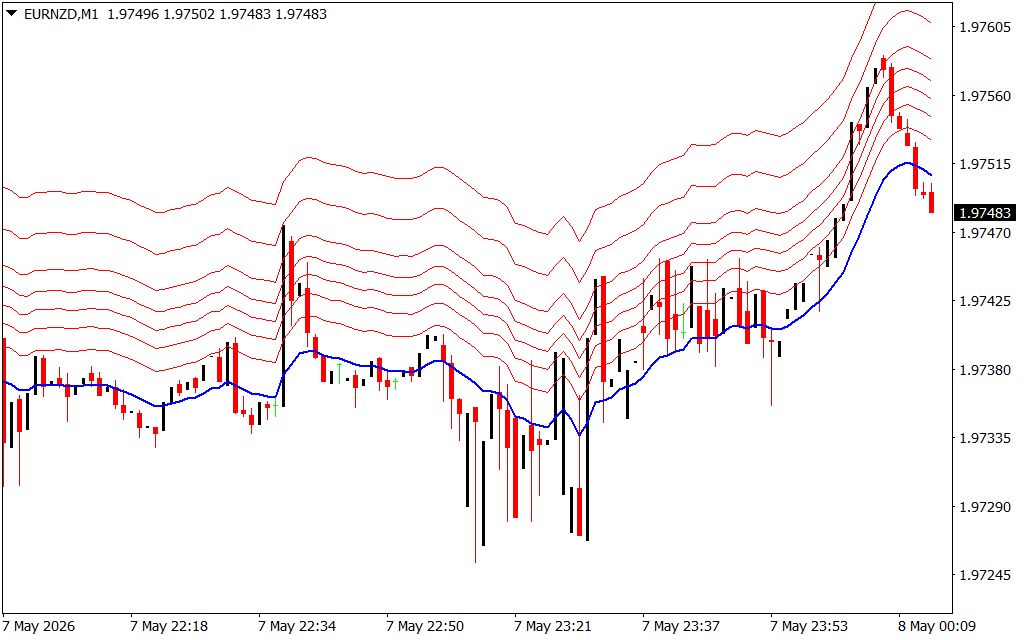
The indicator is built upon a core Instantaneous Moving Average (IMA), which is known for its ability to track Price Action with minimal lag compared to traditional simple or exponential moving averages. Surrounding this core average are several "Fibs Above"—a series of envelope lines calculated using Fibonacci expansion levels. These lines create a multi-tiered resistance map above the current price action, allowing traders to visualize the "ceiling" of any bullish move.
Strategic Benefits for MT4 Traders
- Dynamic Target Acquisition: Instead of static horizontal levels, the IMA Fibs Above adapts to current market volatility. This ensures your profit targets expand during high-momentum moves and contract during consolidation.
- Overextension Alerts: When price action pierces the outermost Fibonacci bands, it indicates a highly overextended market. For scalpers, this is a prime signal to tighten stop losses or exit long positions before a mean reversion occurs.
- Trend Strength Visualization: The fanning out of the red Fibonacci lines indicates accelerating bullish momentum. Conversely, when the lines begin to cluster or flatten, it suggests that the current trend is losing its mathematical backing.
- Precision Scalping: As seen on the M1 chart, the IMA Fibs Above is an exceptional tool for short-term traders. It provides clear "zones" for taking partial profits as price climbs through each consecutive Fibonacci tier.
How to Trade with IMA Fibs Above
The most effective way to use this indicator is as a secondary confirmation for trend-following strategies. When price is trading above the primary blue IMA line, the bias is bullish. Traders look for entries on pullbacks to the blue line and use the upper red Fibonacci bands as logical "take profit" levels.
In a powerful breakout, price will often "ride" one of the inner Fibonacci lines. If price closes above one tier, the next tier becomes the immediate objective. This systematic approach takes the emotional guesswork out of trading, providing a clear roadmap for every bullish expansion.
Whether you are a professional day trader or a hobbyist scalper, the IMA Fibs Above indicator provides the mathematical structure needed to capture maximum gains from market trends.
1 Download
Last Update:
May 08, 2026 03:15 AM
Published:
Jan 25, 2026 22:06 PM
Category: