Streamline Multi-Frame Technical Analysis: Timeframe Zoom Per Chart Indicator for MT4
Navigating data-dense financial markets requires rapid shifts in perspective. For retail day traders and professional scalpers, matching the micro-execution triggers on a 1-minute (M1) or 15-minute (M15) chart with the macro trend structure of a 4-hour (H4) or Daily screen is a constant operational challenge. The Timeframe Zoom Per Chart Indicator addresses this workflow bottleneck by offering an interactive, completely independent magnification and period utility built directly into your MetaTrader 4 template.
Overcoming the Structural Constraints of Default Charting
By default, global charting platforms link basic workspace scaling adjustments together. When you use standard terminal hotkeys to zoom in or change periods, the platform frequently applies those structural changes globally or forces you to manually reset your coordinates across multiple active window tiles.
This layout tool removes layout friction entirely, enabling asymmetric workspace scaling on liquid pairs like the EUR/USD:
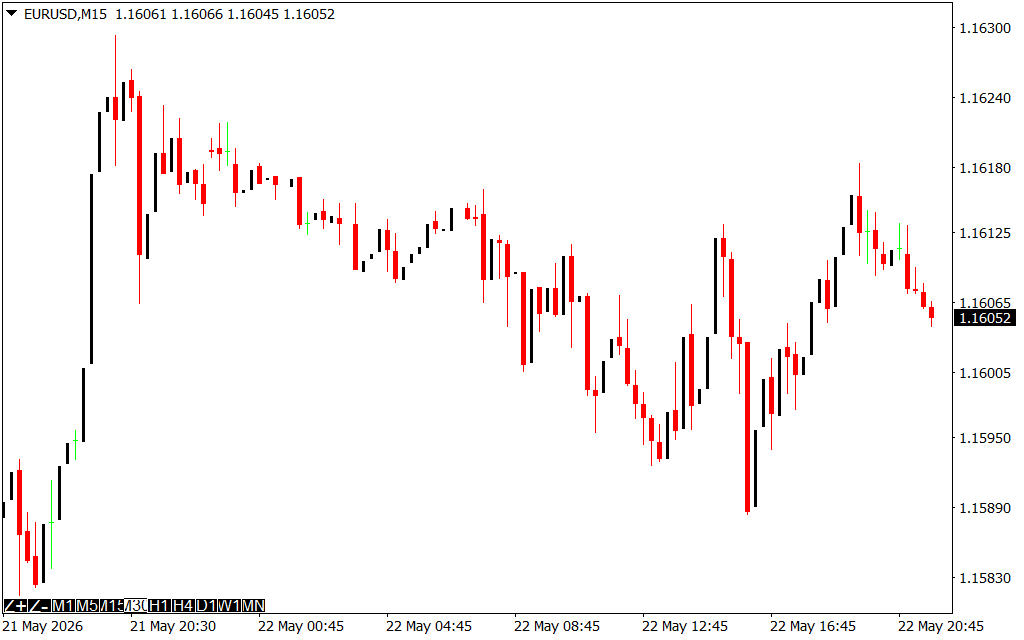
- Independent Scale Memory: Remembers your exact structural zoom preferences for every individual chart window. You can keep an M15 window tightly focused on immediate candle wicks while keeping an H1 window zoomed out to view major liquidity pools.
- On-Chart Command HUD: Adds a clean, text-based Heads-Up Display directly over your candlesticks. This interface tracks the current instrument asset symbol, active timeframe, and fractional spread levels in real-time.
- Zero-Friction Spatial Tracking: Allows you to monitor historical order blocks and micro-trend consolidations simultaneously without losing track of your price sidebars or horizontal coordinates.
By giving you localized control over each independent chart panel, this tool eliminates layout adjustments and helps you spot key technical patterns across multiple timeframes.
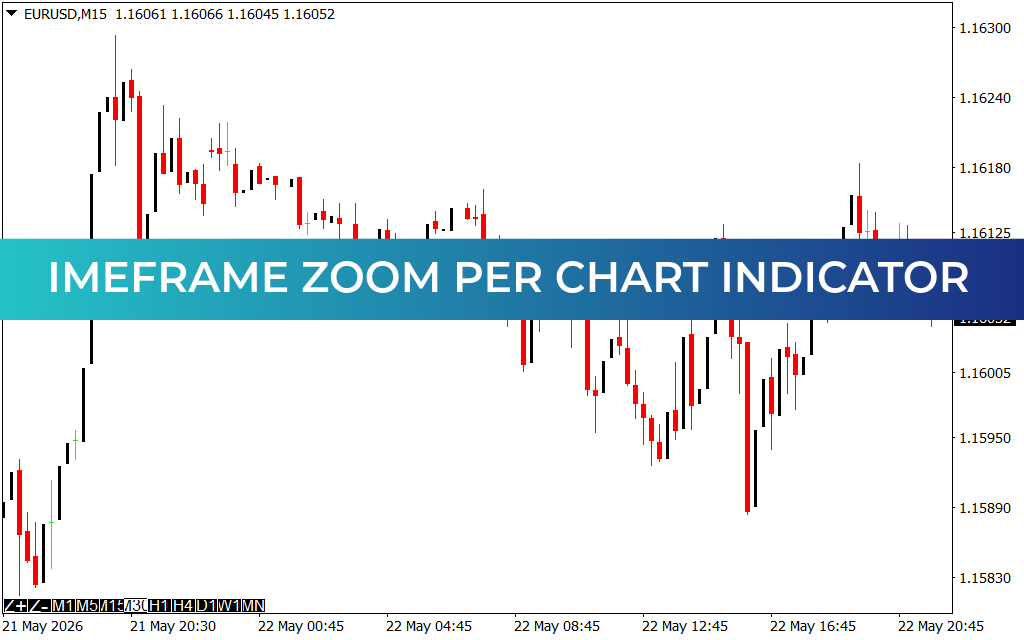
Strategic Execution on the EUR/USD M15 Layout
During high-volume sessions like the London and New York cross, Price Action moves rapidly through institutional supply corridors. On a standard M15 chart workspace, a sharp momentum run can quickly distort your viewing area, pushing critical historical pivot levels completely out of sight.
Systematic market participants can utilize the Timeframe Zoom Per Chart indicator to coordinate two core trading models:
- Micro-Structure Drill Downs: When price drives deep into a macro weekly resistance zone, use the localized zoom function to isolate sub-hour price candles on your execution screen. This lets you inspect immediate candlestick rejection patterns while keeping your broader macro perspective intact.
- Dynamic Spread & Volatility Tracking: Use the on-chart HUD text to monitor real-time transaction costs during high-impact news releases. If the spread expands beyond acceptable levels, your risk parameters are instantly protected without checking terminal market watch bars.
Core Features for Advanced Technical Workspaces
- Independent Geometric Scaling: Isolates structural zoom levels per window panel, stopping messy global chart resets when you alter your technical focus.
- Integrated Interactive Text HUD: Renders asset information, specific timeframes, and live broker spreads cleanly on your main charting layout.
- Universal Optimization Engine: Built with a no-lag computational core that updates immediately on every live price tick without causing terminal lag or platform drag.
The Timeframe Zoom Per Chart Indicator acts as a vital command center upgrade for your trading station, converting raw ca
2 Downloads
Last Update:
May 23, 2026 02:13 AM
Published:
Jan 16, 2026 09:20 AM
Category: