Mastering Trends: The Power of the Jurik Bollinger Bands Stop Indicator
Traditional Bollinger Bands are highly valued for mapping market volatility, but standard calculations often lag behind swift price moves or produce noisy, false signals in choppy conditions. For traders seeking precision timing and crystal-clear trend confirmation, the Jurik Bollinger Bands Stop Indicator offers a significant upgrade. By swapping out standard moving averages for ultra-smooth Jurik research mathematics, this indicator creates an adaptive, high-speed trend-following system.
Here is a breakdown of how this advanced tool works and how to integrate it into your daily trading workflow.
Why the Jurik Integration Matters
Standard indicators rely on simple or exponential moving averages ($SMA$ or $EMA$), which inherently suffer from a frustrating trade-off: if you make them smoother to filter out noise, they lag behind current Price Action. If you make them faster to catch breakouts early, they become erratic.
The Jurik Moving Average ($JMA$) solves this problem through an advanced, low-lag smoothing algorithm. When applied to Bollinger Bands, it results in standard deviation lines that react almost instantly to true market reversals while filtering out minor intraday noise. The "Stop" version transforms these bands into an easy-to-read trailing threshold that sits above or below price action.
Reading the Chart and Trading Signals
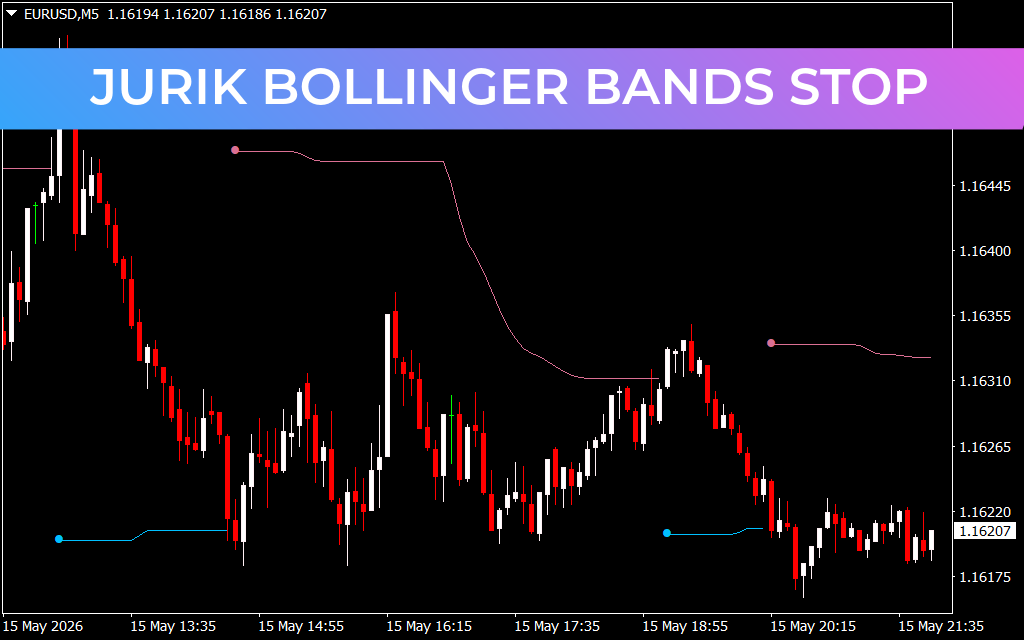
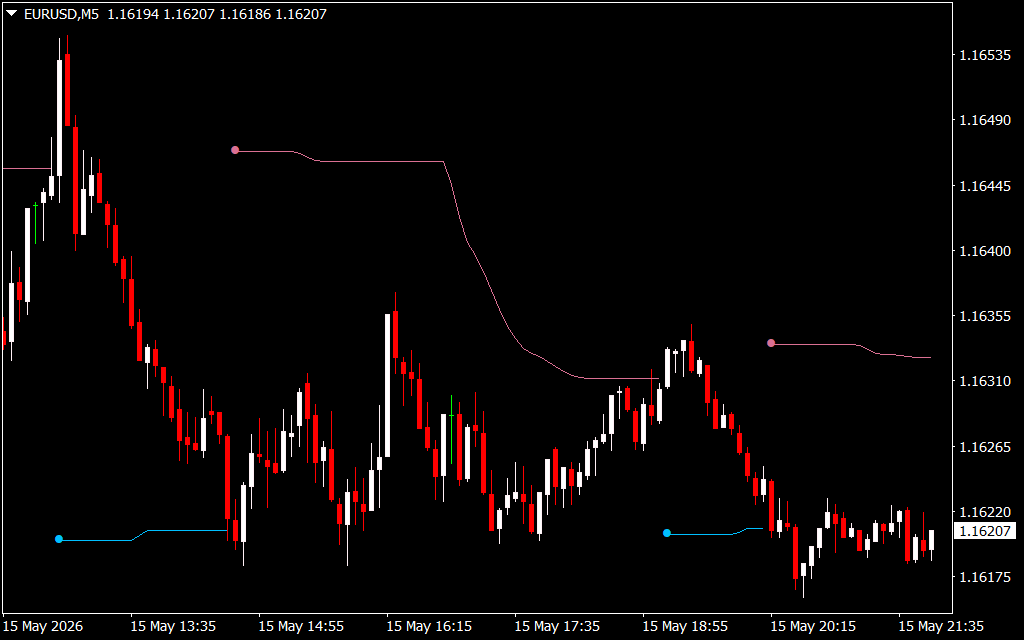
As demonstrated on the EUR/USD M5 chart, the indicator strips away complex lines and leaves you with an intuitive, color-coded trailing stop:
- The Bullish Phase (Blue Dots & Lines): When price breaks and closes above the upper band, a new uptrend is confirmed. The indicator shifts below the price candles, displaying a blue line with a starting dot. This serves as a real-time support level.
- The Bearish Phase (Pink Dots & Lines): Conversely, when price slips and closes below the lower band, a downtrend begins. The indicator flips above the price candles, tracking downward as a pink line. This acts as a dynamic resistance boundary.
Because the calculation adapts dynamically to market volatility, the lines flatten out during tight consolidations and accelerate rapidly downwards or upwards when strong momentum kicks in.
Smart Risk Management with Volatility Stops
Beyond identifying trend direction, this tool excels as an automated risk management companion:
- Precision Trailing Stop-Loss: If you enter a short trade during a pink phase, the pink line itself acts as your ultimate stop-loss level. You can manually trail your stop-loss order just a few pips above this line as it moves downward, locking in profits while giving the asset breathing room.
- Filtering Fakeouts: On lower timeframes like the 5-minute chart, micro-spikes often trigger false exits. The smooth architecture of the Jurik calculation ensures that you are only knocked out of a trade when a true Trend Reversal occurs.
- Combining for Confluence: For the highest win rates, use this indicator to manage your exits on a lower timeframe (like the M5) while ensuring your trades align with the broader market direction on a higher timeframe (like the H1 or H4).
4 Downloads
Last Update:
May 17, 2026 01:38 AM
Published:
Jan 21, 2026 01:28 AM
Category: